Stata cheat sheets
with Tim EssamBackground
When teaching an intro class on Stata, we realized that there were no good reference materials on Stata. What started off as a “let’s make a quick cheat sheet for the basic functions” quickly evolved into a comprehensive set of 6 cheat sheets on the common data wrangling and analysis functions within Stata.
Solution
After cataloguing the most common functions, we organized them into six basic functional areas: basic data processing, data manipulation, data visualization, visualization customization, basic analysis, and basic programming. Then came the tricky part: how are all these functions related? What’s the underlying logical and organizational framework? After sketching out these relationships, we created the layouts in Adobe Illustrator, heavily inspired by Rstudio’s amazing R cheat sheets.
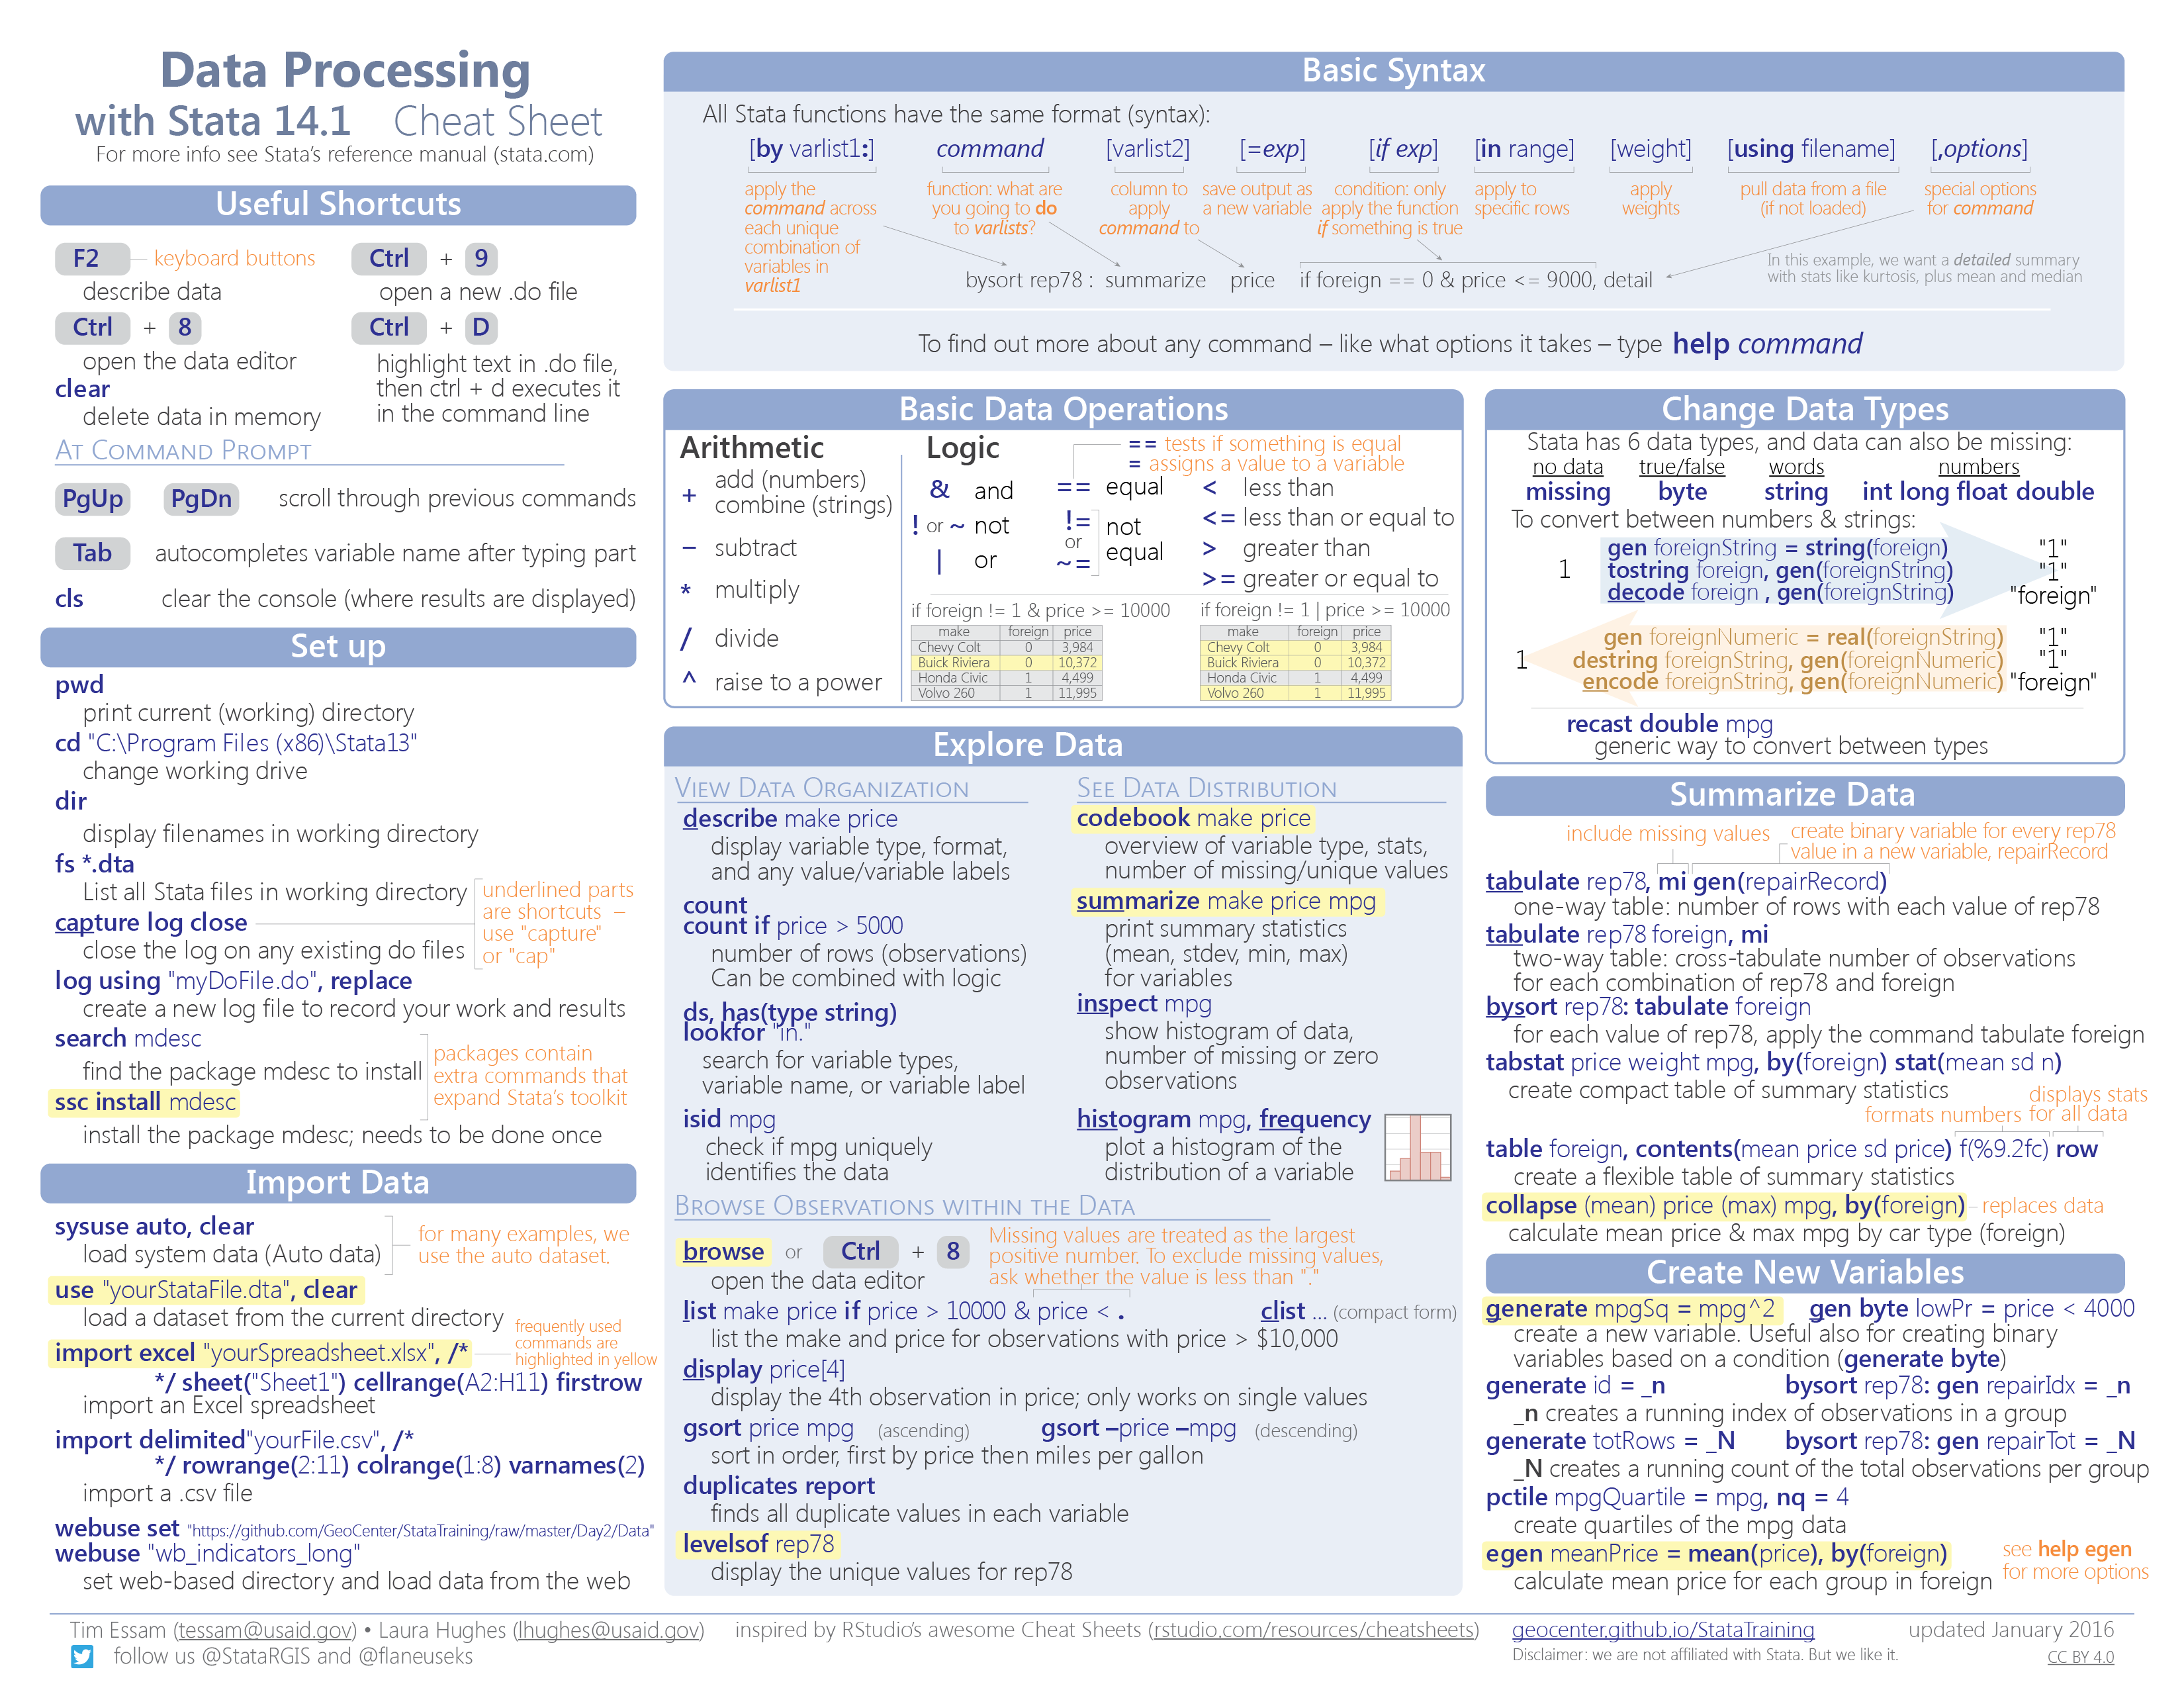
Data Processing
- basic Stata syntax for all functions
- basic math and logic operations
- setting up working directories and log files
- importing data
useimport excel
- converting between data types
- exploring data files
codebooksummarize
- summarizing and collapsing data in tables
tabulatecollapse
- creating new variables
generateegen
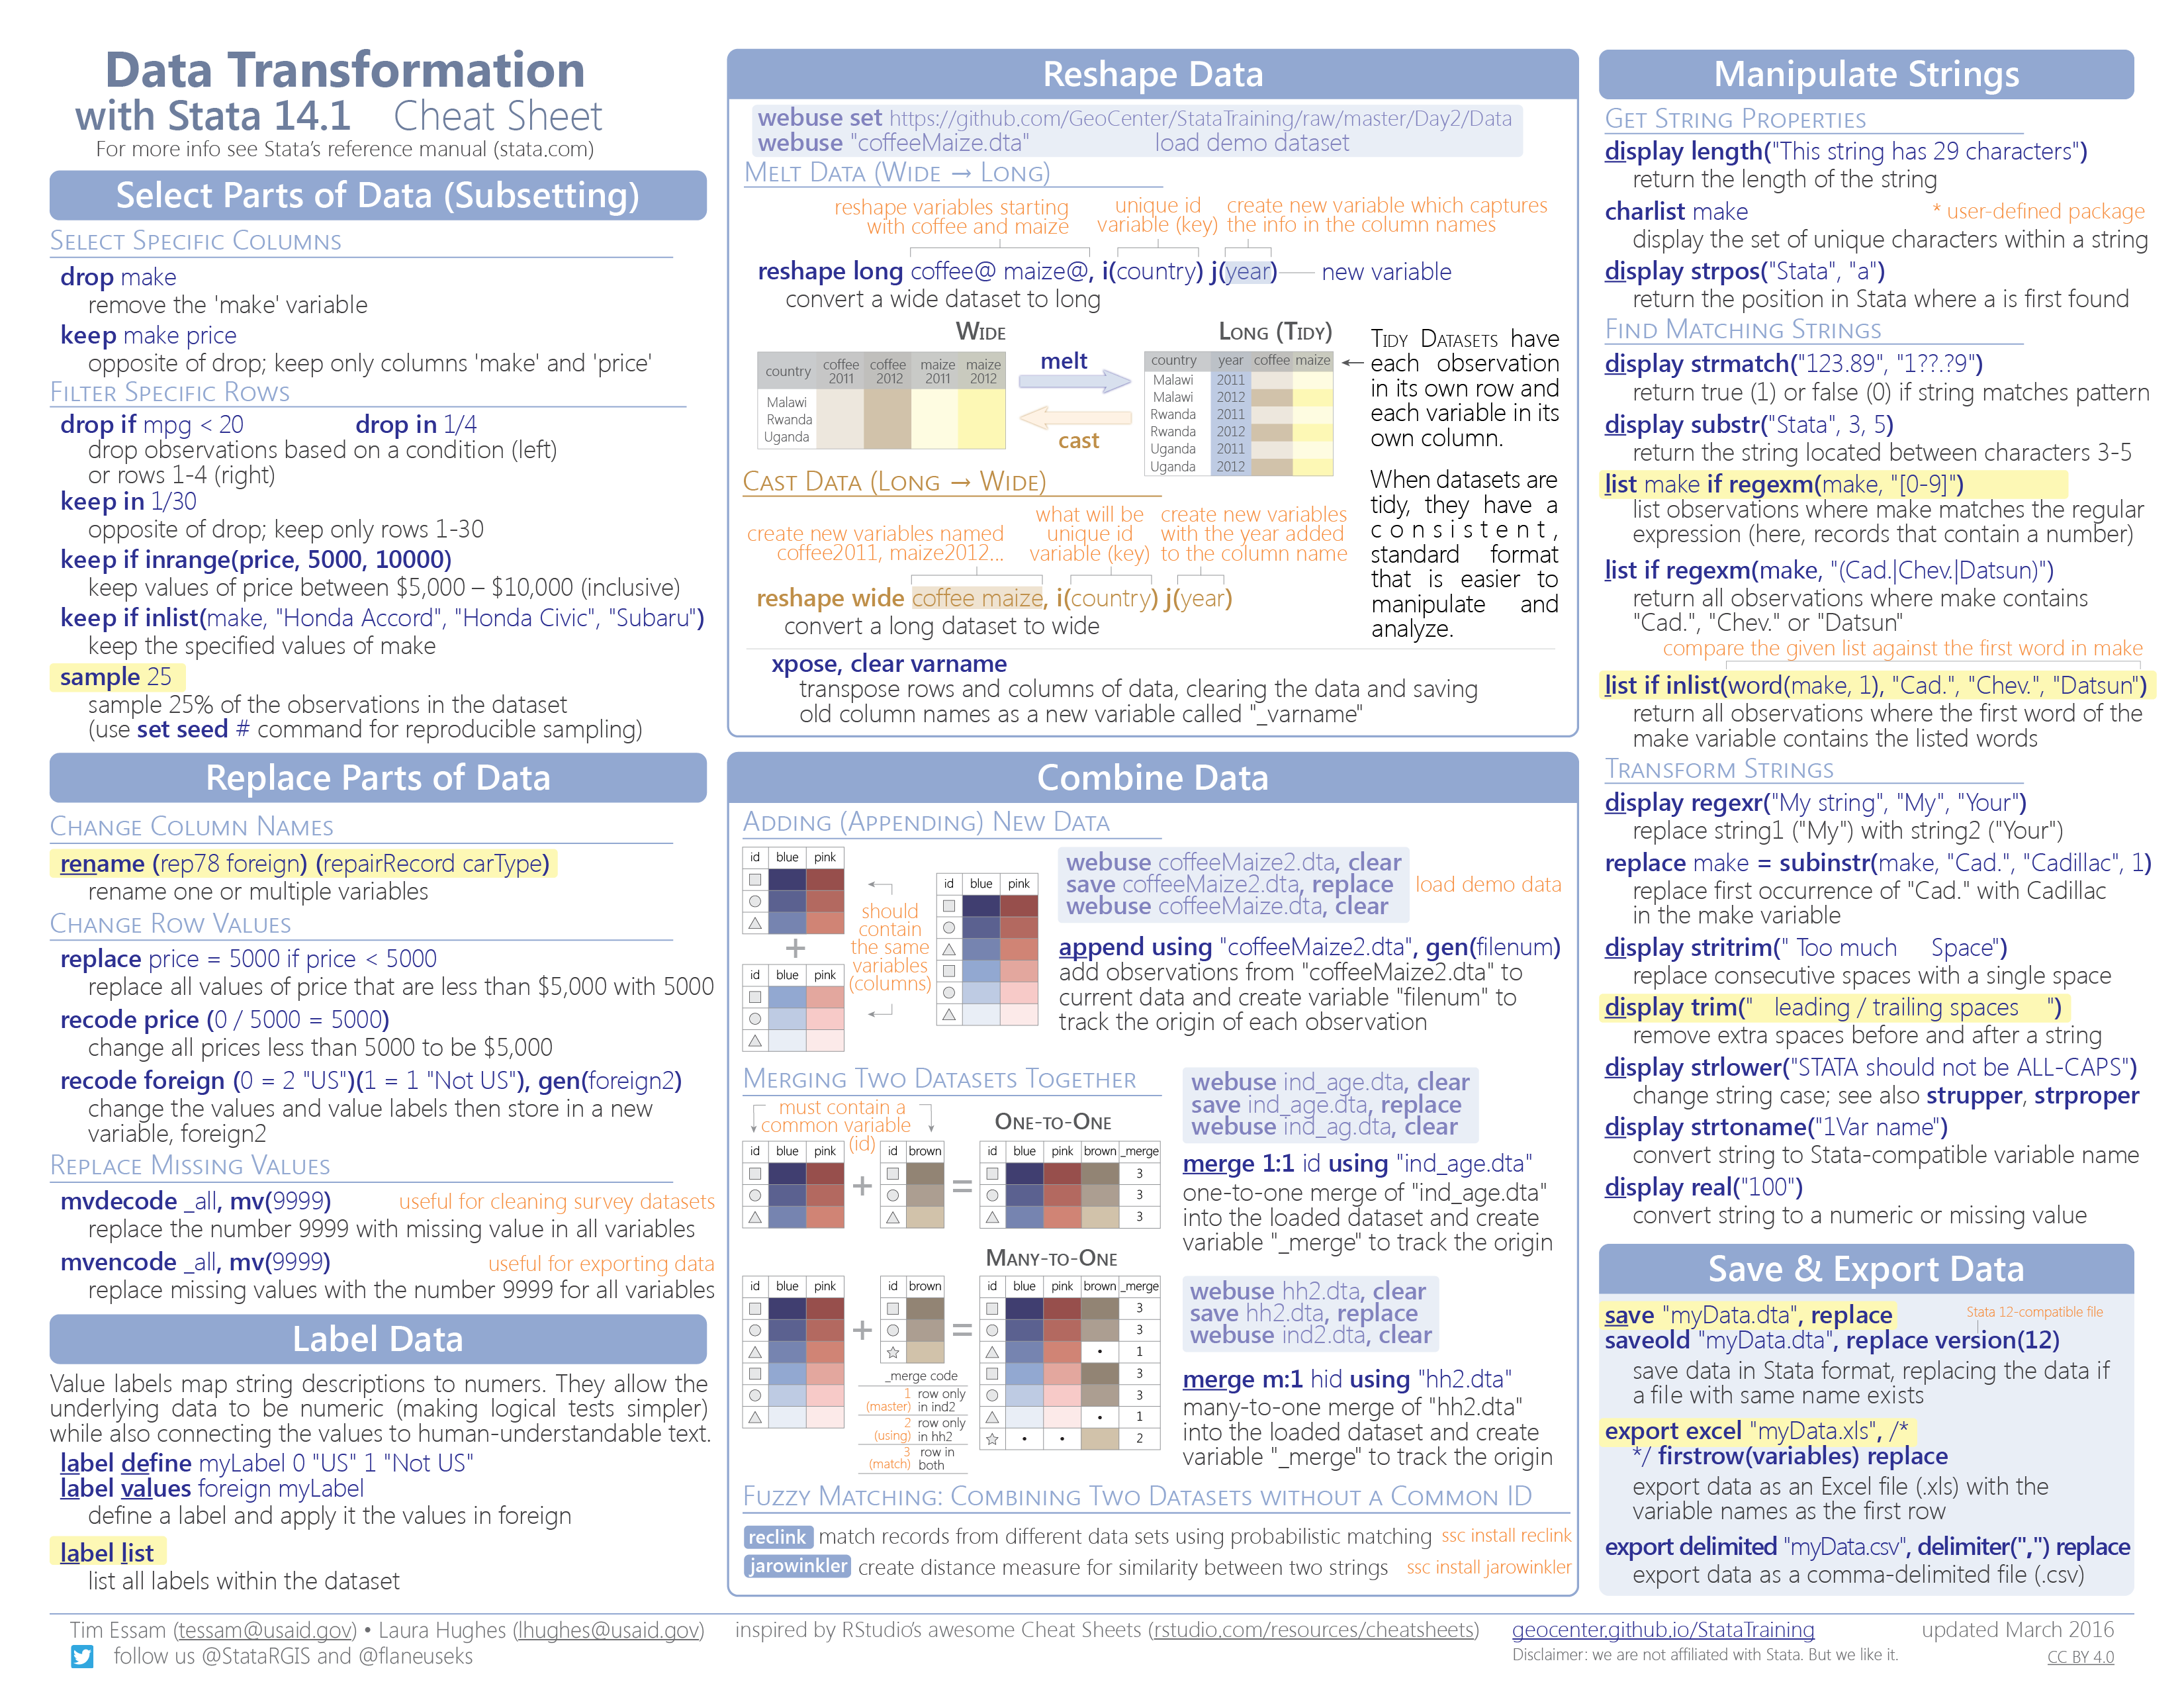
Data Transformation
- subsetting data
dropkeep
- replacing data
renamereplacerecode
- using variable and value labels
label definelabel list
- reshaping data (melting and casting)
reshape
- merging and appending
appendmerge- fuzzy-matching
- string transformations
- saving and exporting data
saveexport excel
Data Visualization
- small multiples
- one variable visualizations
histogramkdensity: smoothed histogramgraph bar: bar plotgraph dot: dot plotgraph hbox: box and whiskers
- two variable visualizations
tw scatter: scatter plottw connected: line plottw area: area plottwo pcspike: parallel coordinates plottw pccapsym: slope/bump chart
- three variable visualizations
plotmatrix: heatmap
- plotting with summarization or fitting
binscatter: plot summary valuetw lfitci: linear fittw lowess: lowess smoothing
- plotting regression results
coefplot: regression coefficientsmarginsplot: marginal effects
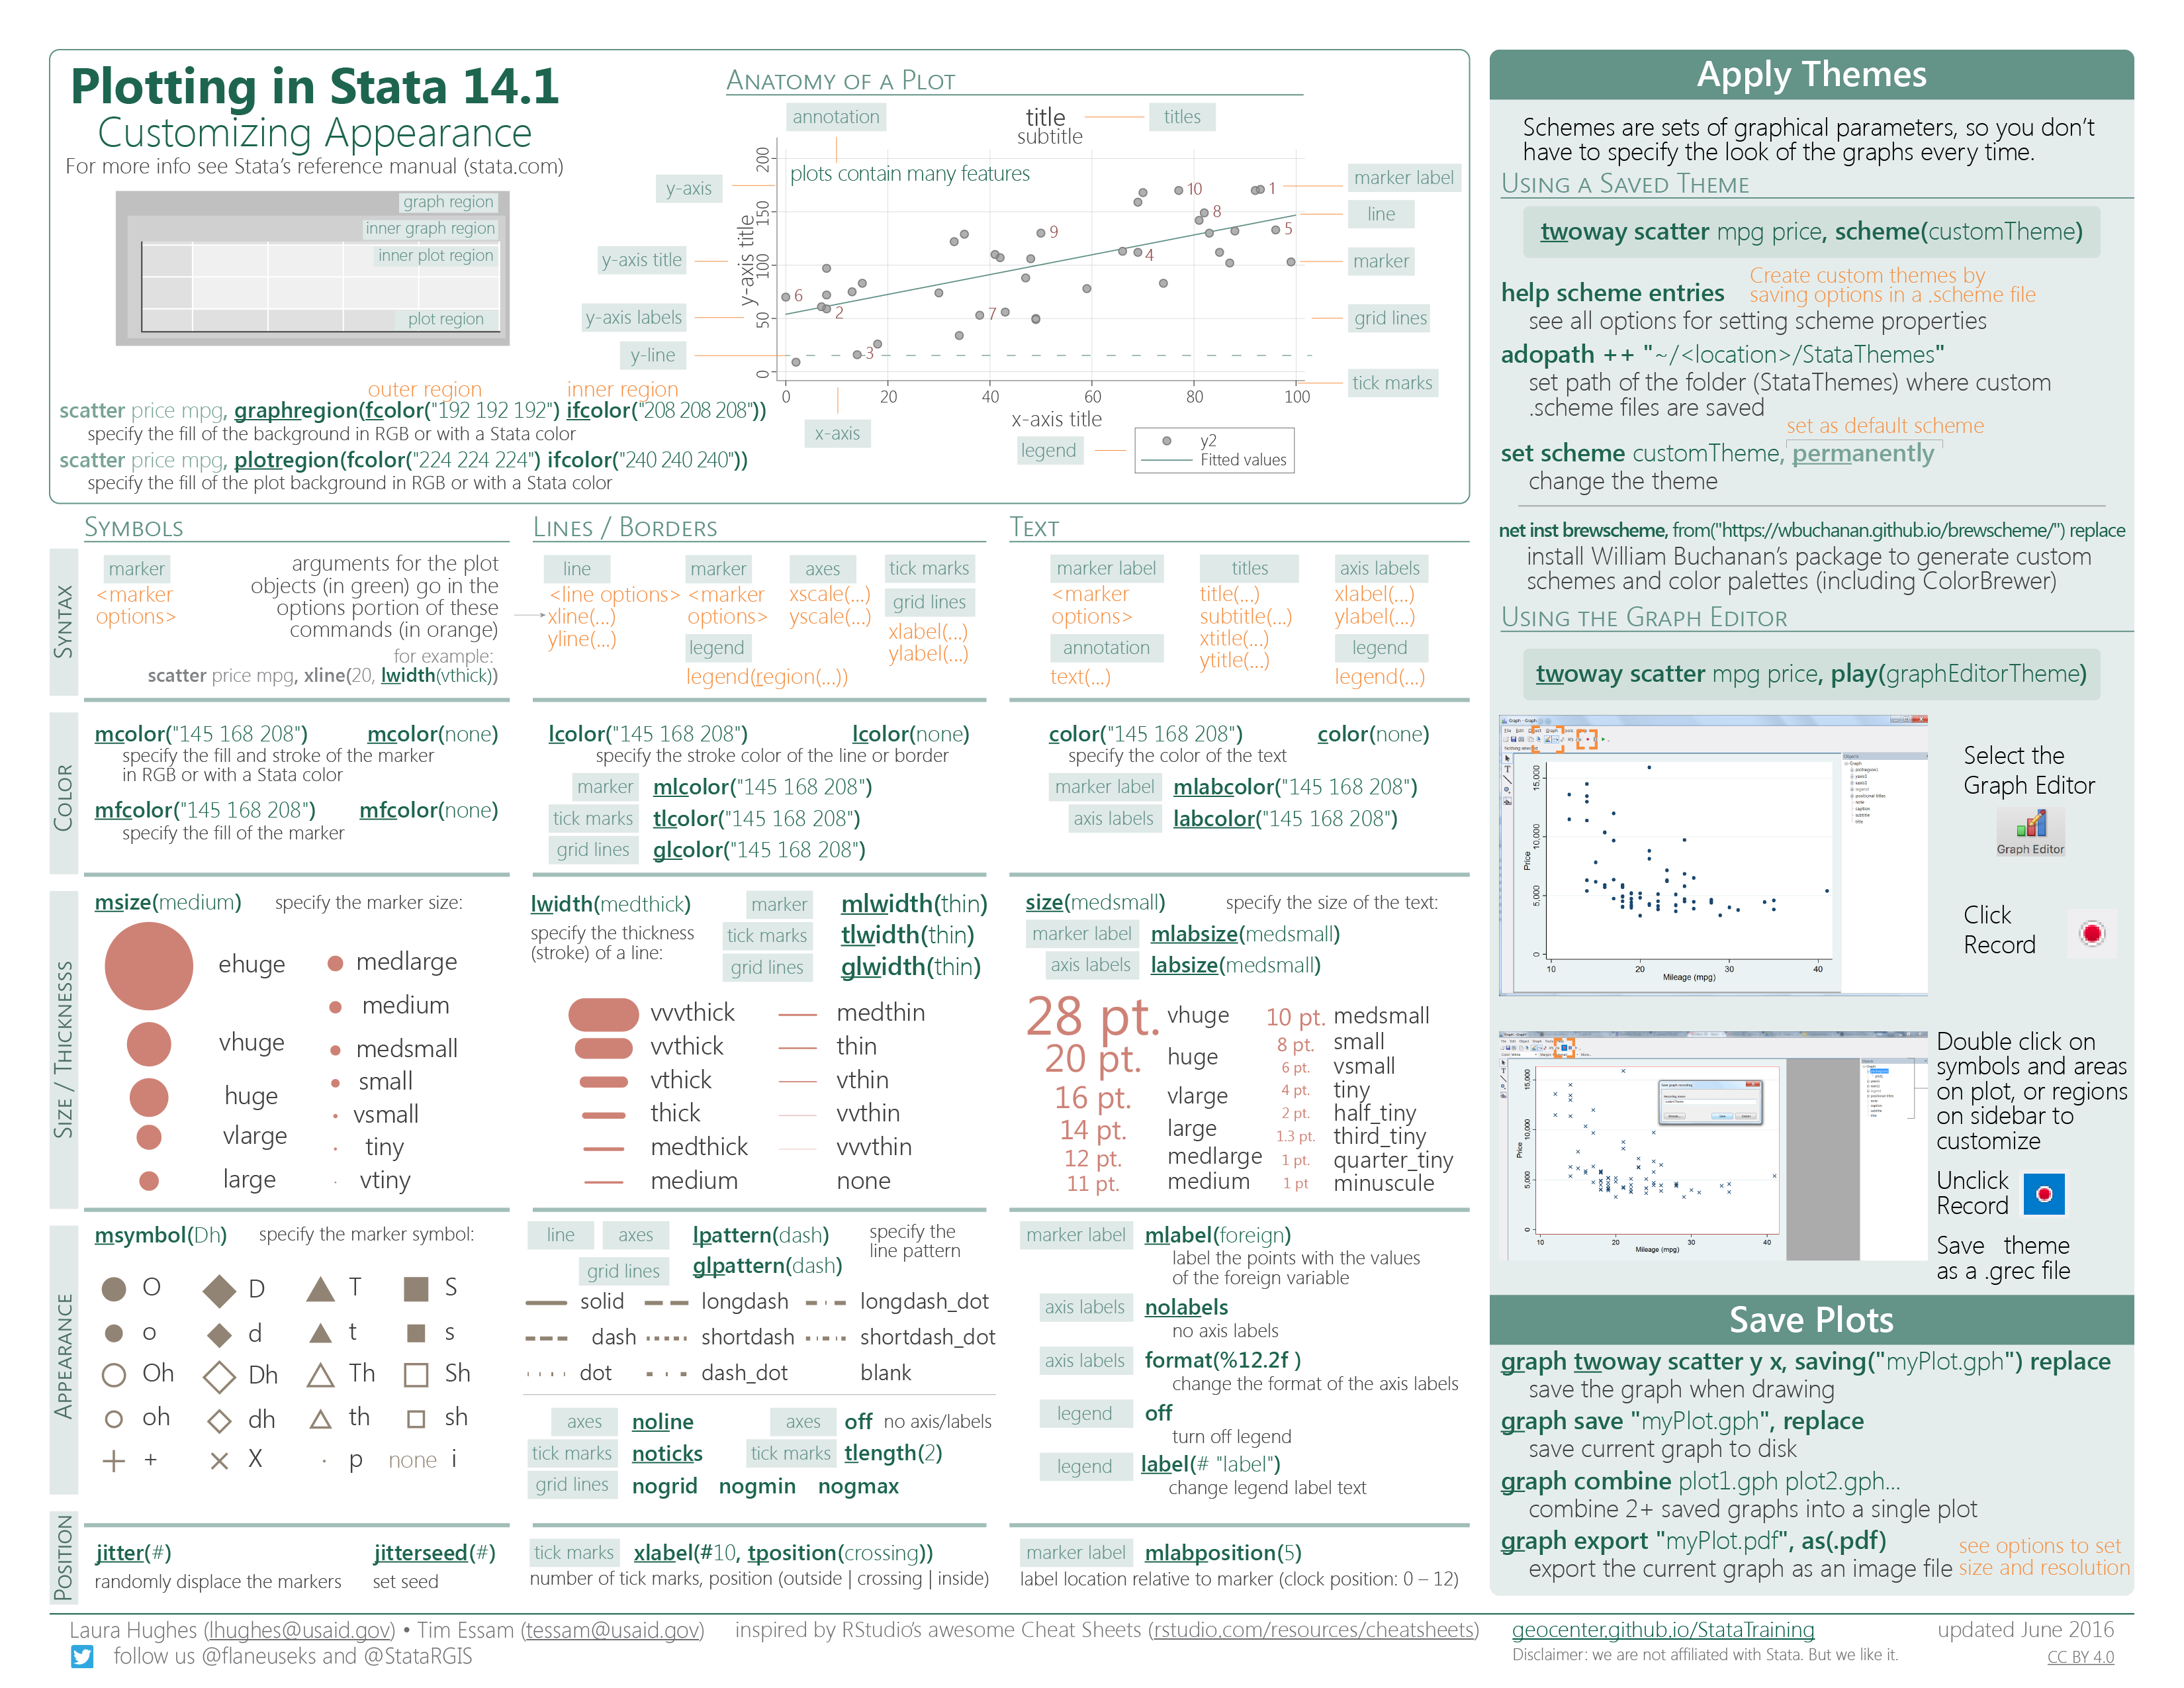
- Changing marks
- symbology
- lines
- text
- Changing channels
- size
- color
- shape
- position
- Using themes
- Saving plots
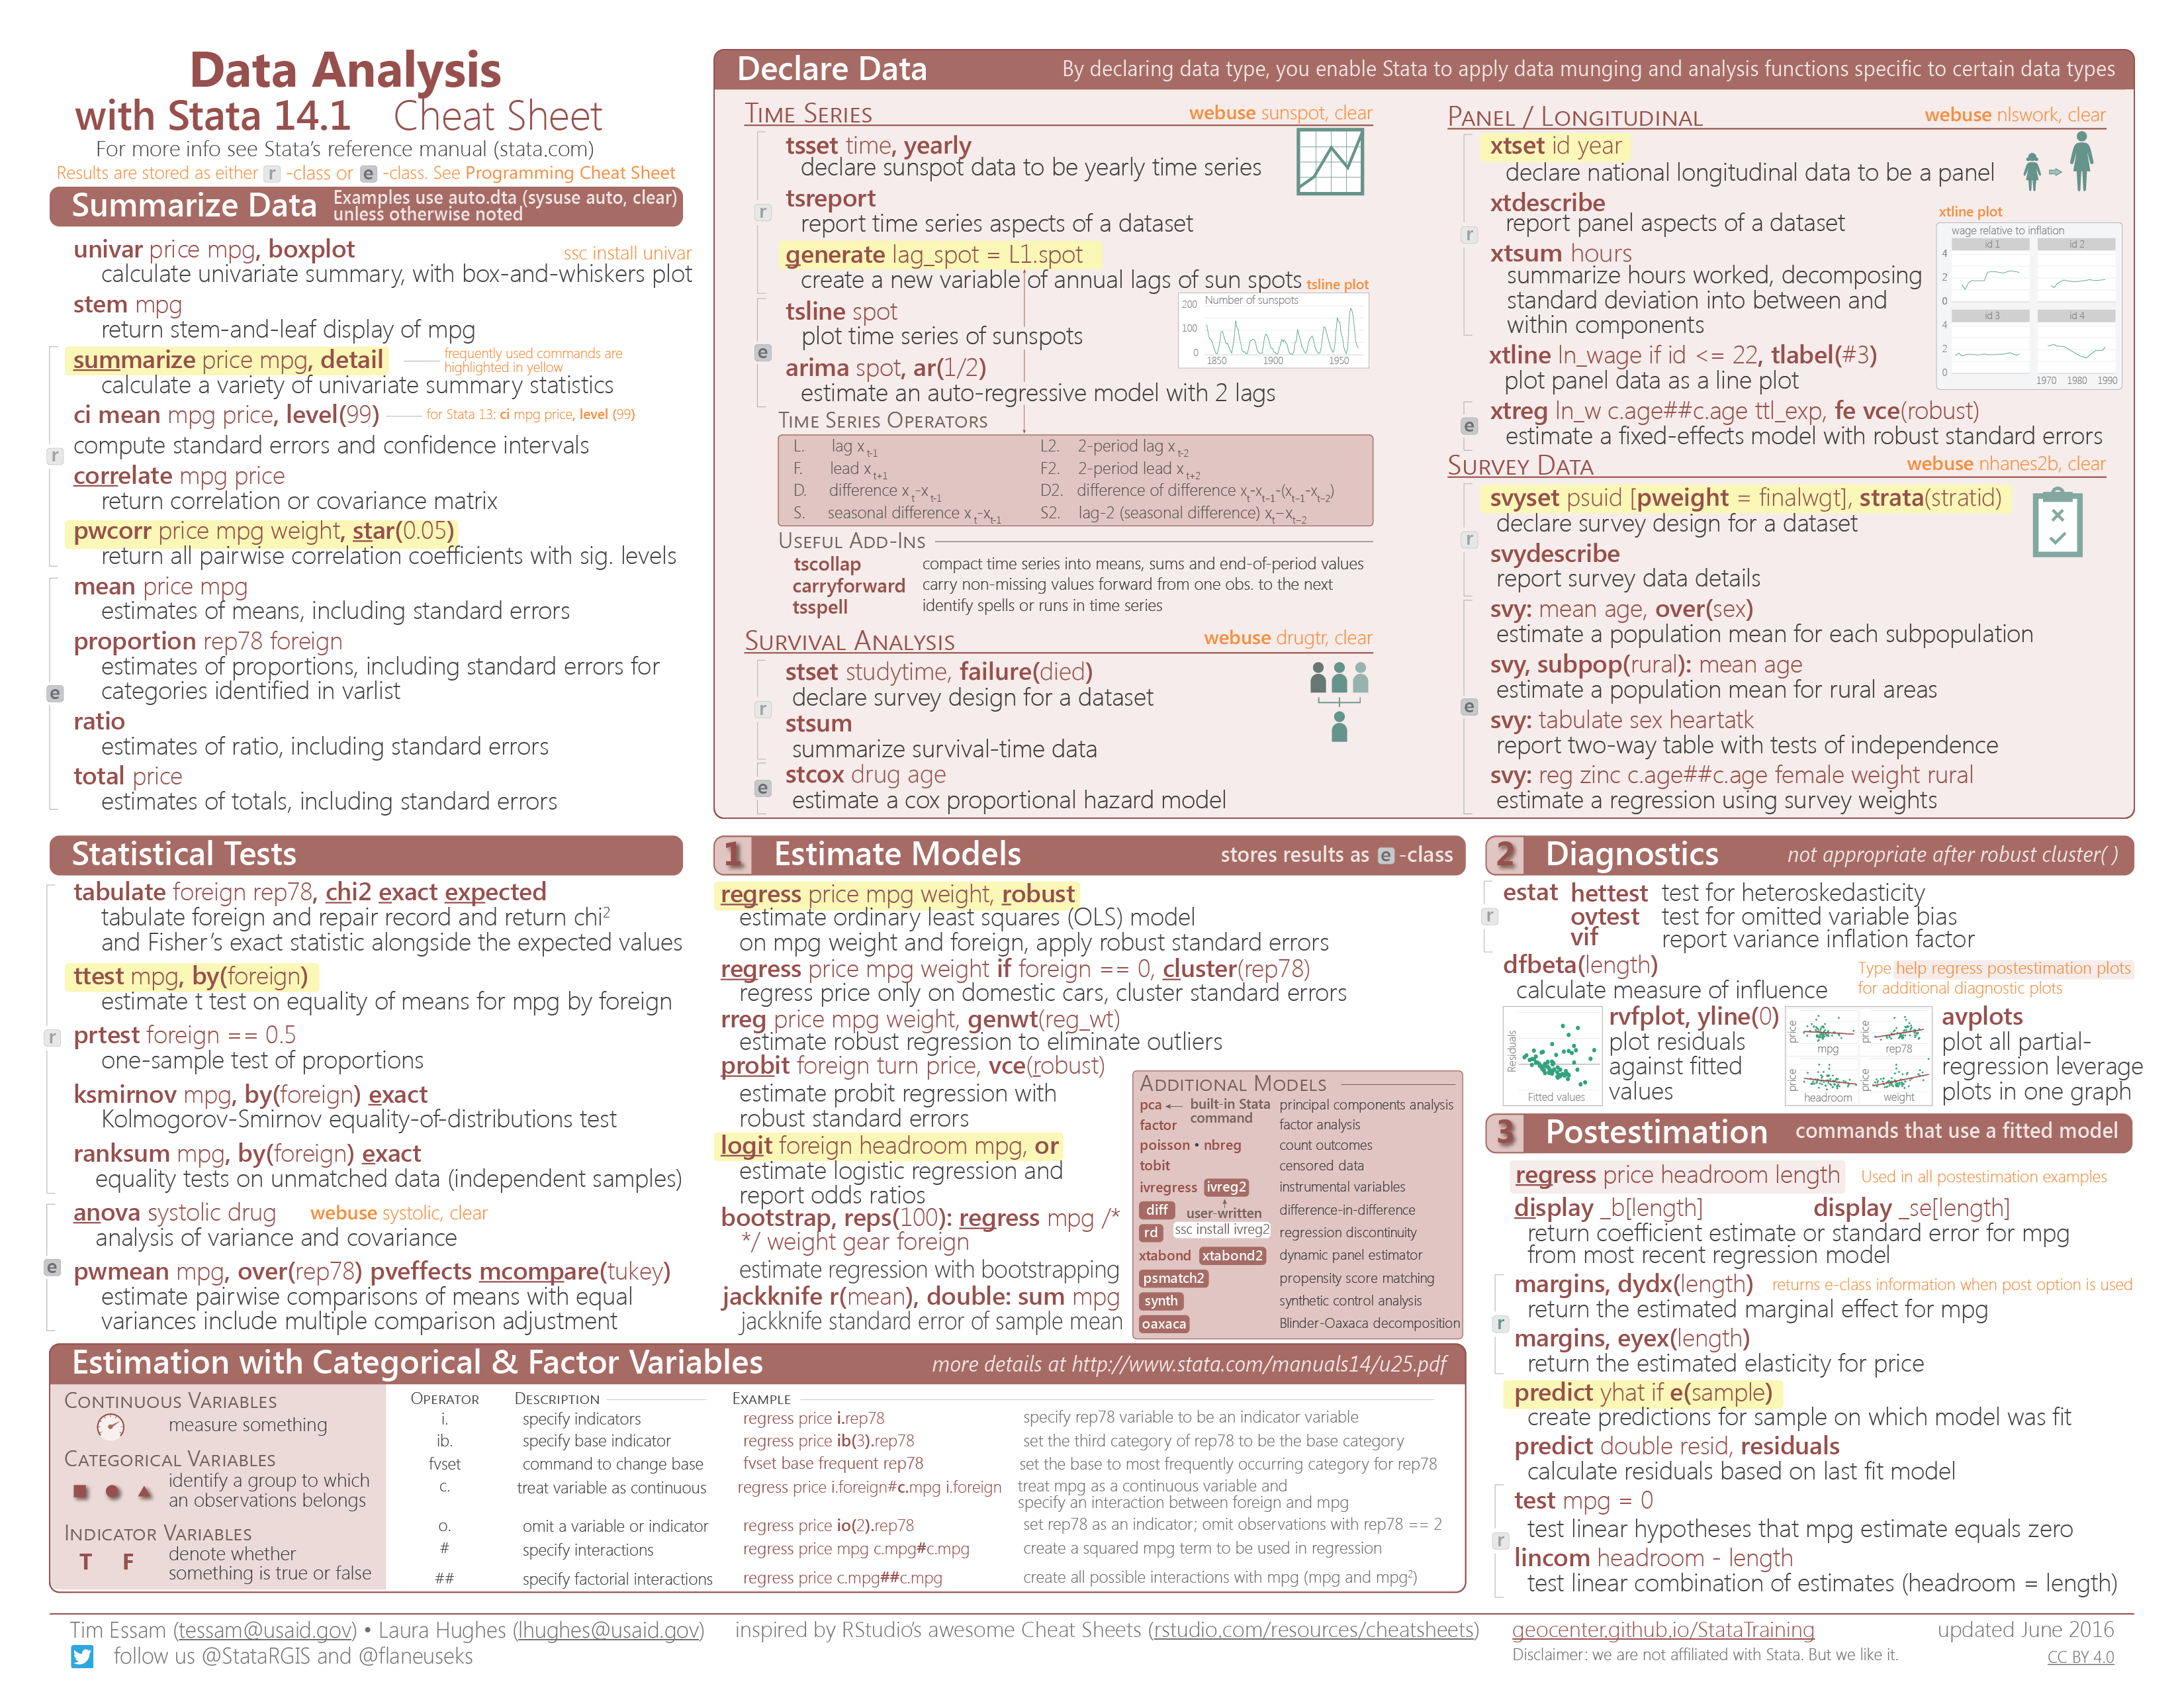
Data Analysis
- declaring data as a special type
- time series
- survival analysis
- longitudinal/panel
- survey
- summarizing data, correlations, point estimates, etc.
summarizepwcorr
- statistical tests
- t-tests, ANOVAs, proportions, distributions, etc.
- estimating models
regresslogit- delaring interactions within model
- evaluating models
- postestimation calculations (use model for something)
predict
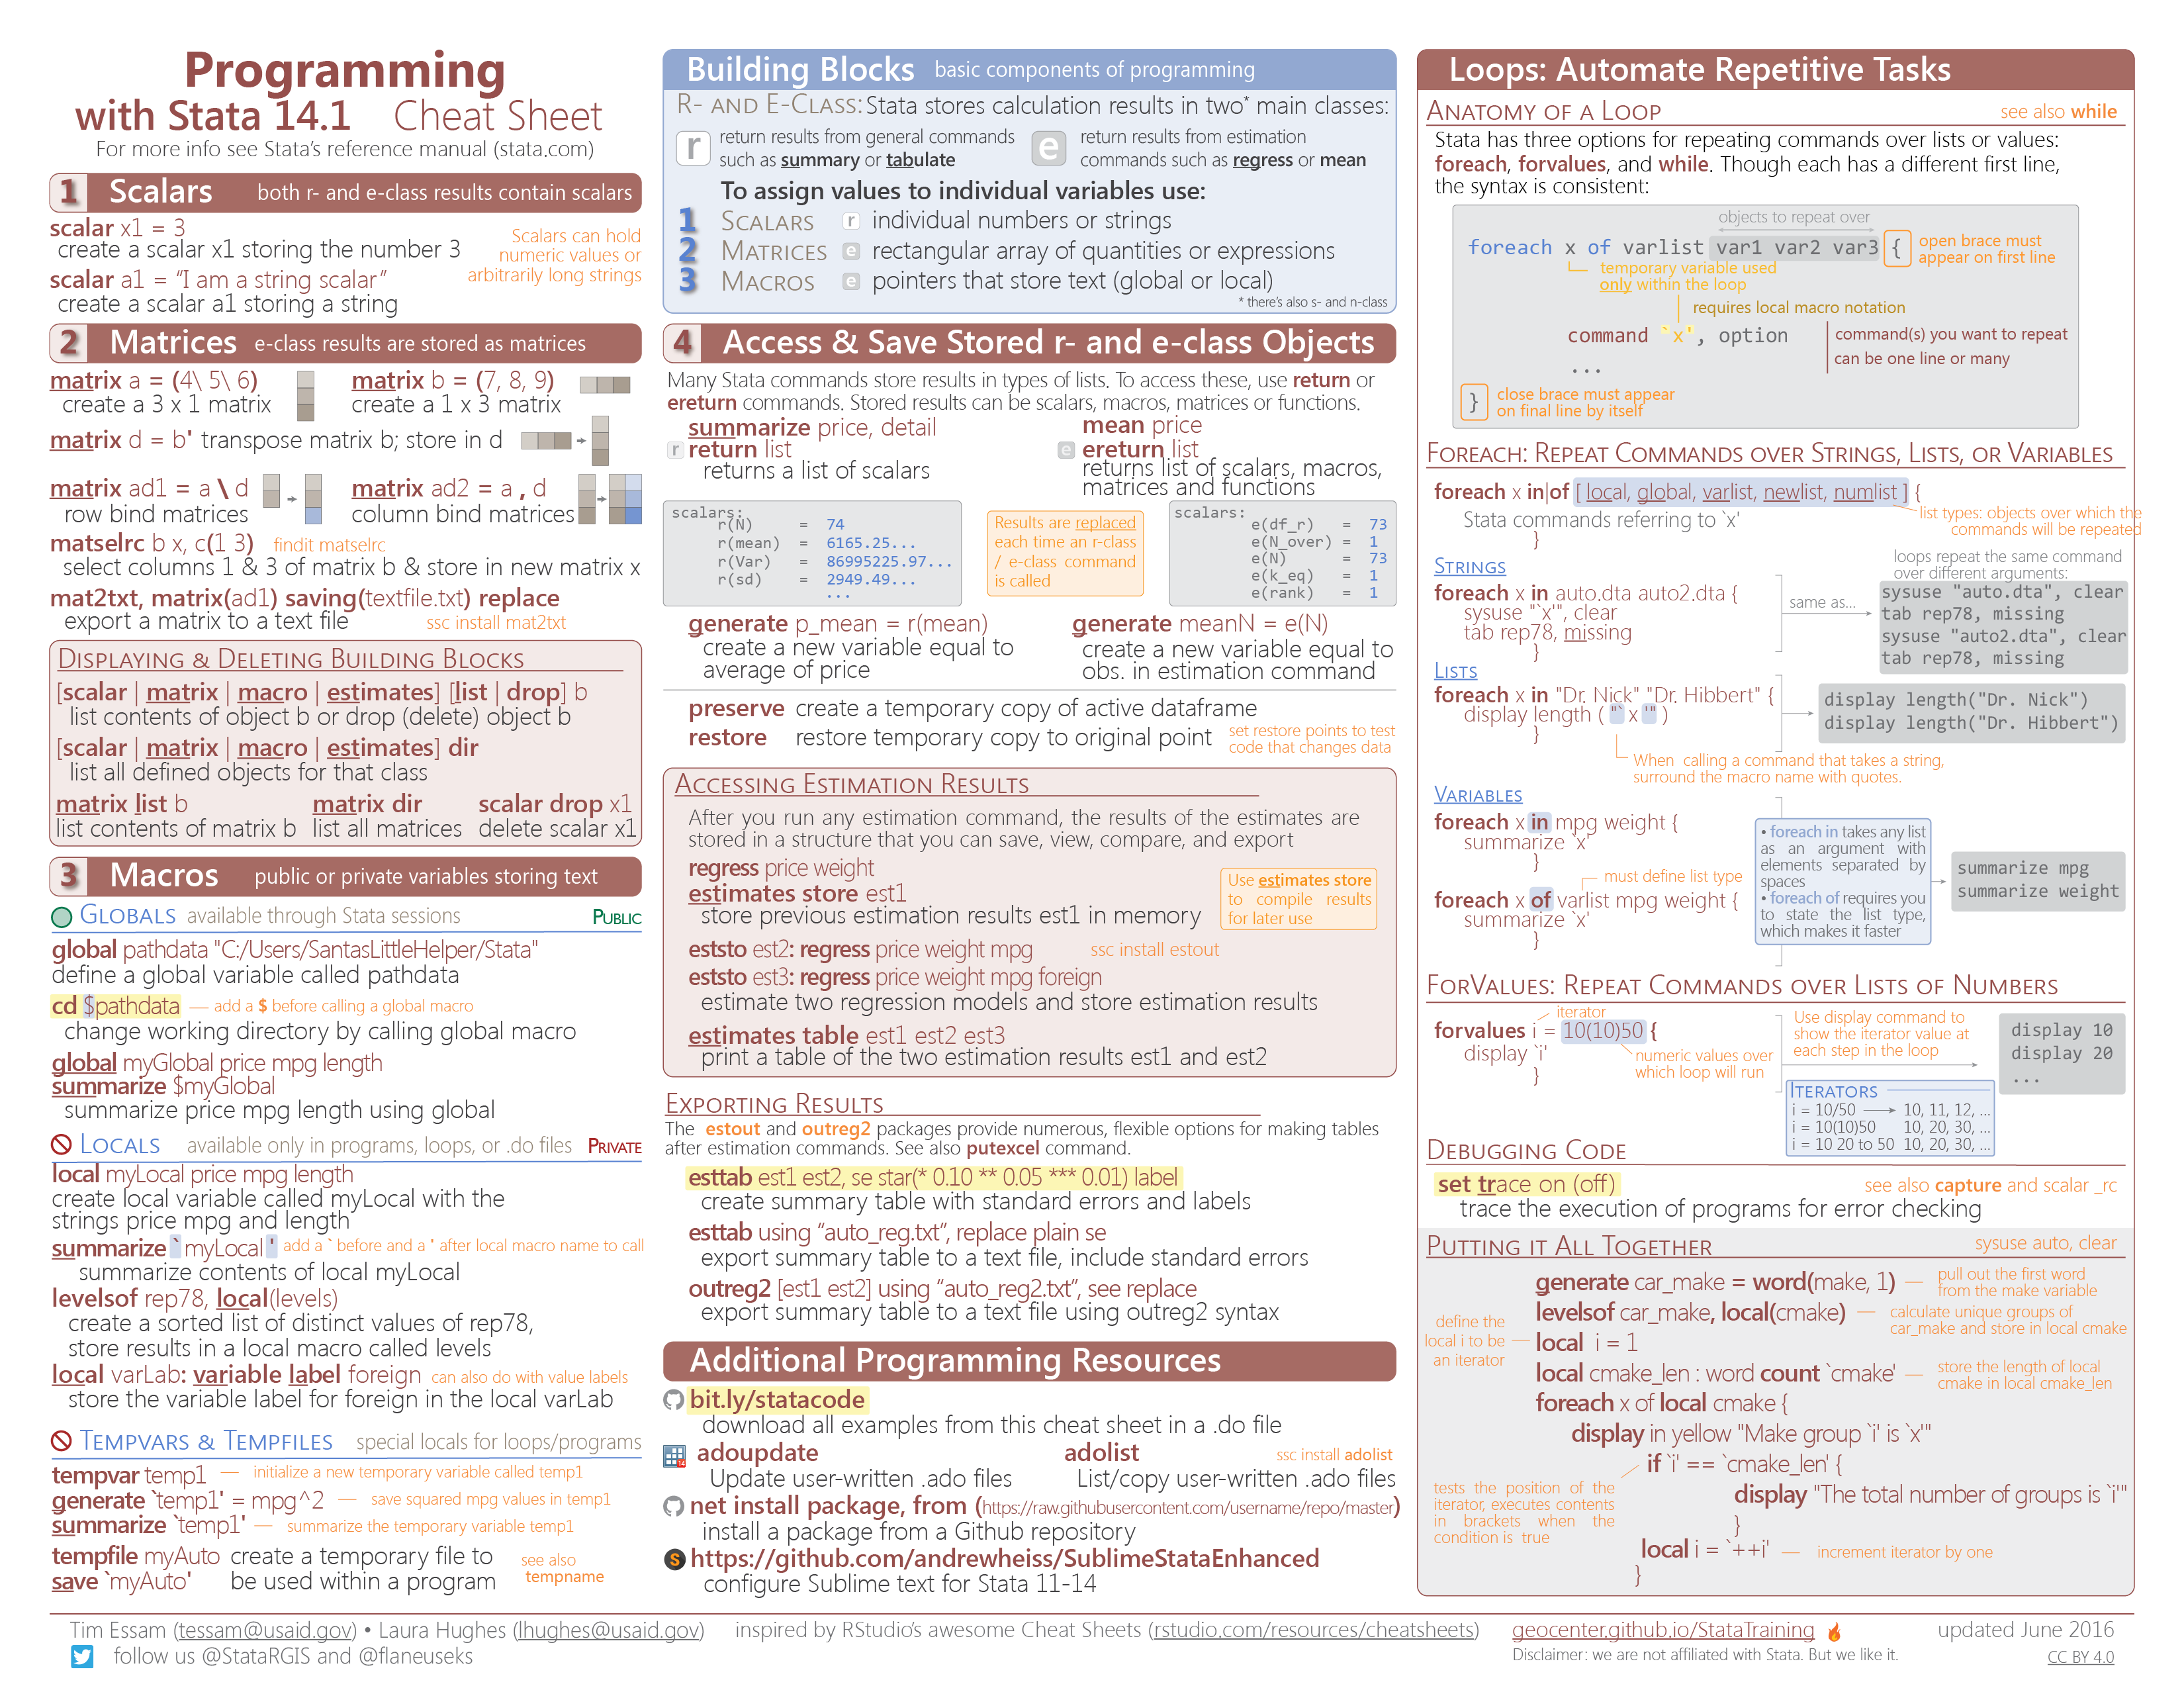
Programming
- fundamental data types
- scalars
- matrices
- macros
- accessing stored results
return: r-class objectse-return: e-class objects
- loops
foreachforvalues
- additional programming resources: using github in Stata