Rwanda partner coordination
Background:
I developed this product for a large international development donor organization that provides funding to numerous partners working in Rwanda. With partners working across the country, the product was intended to visualize and promote the coordination of development activities amongst partners.
Solution:
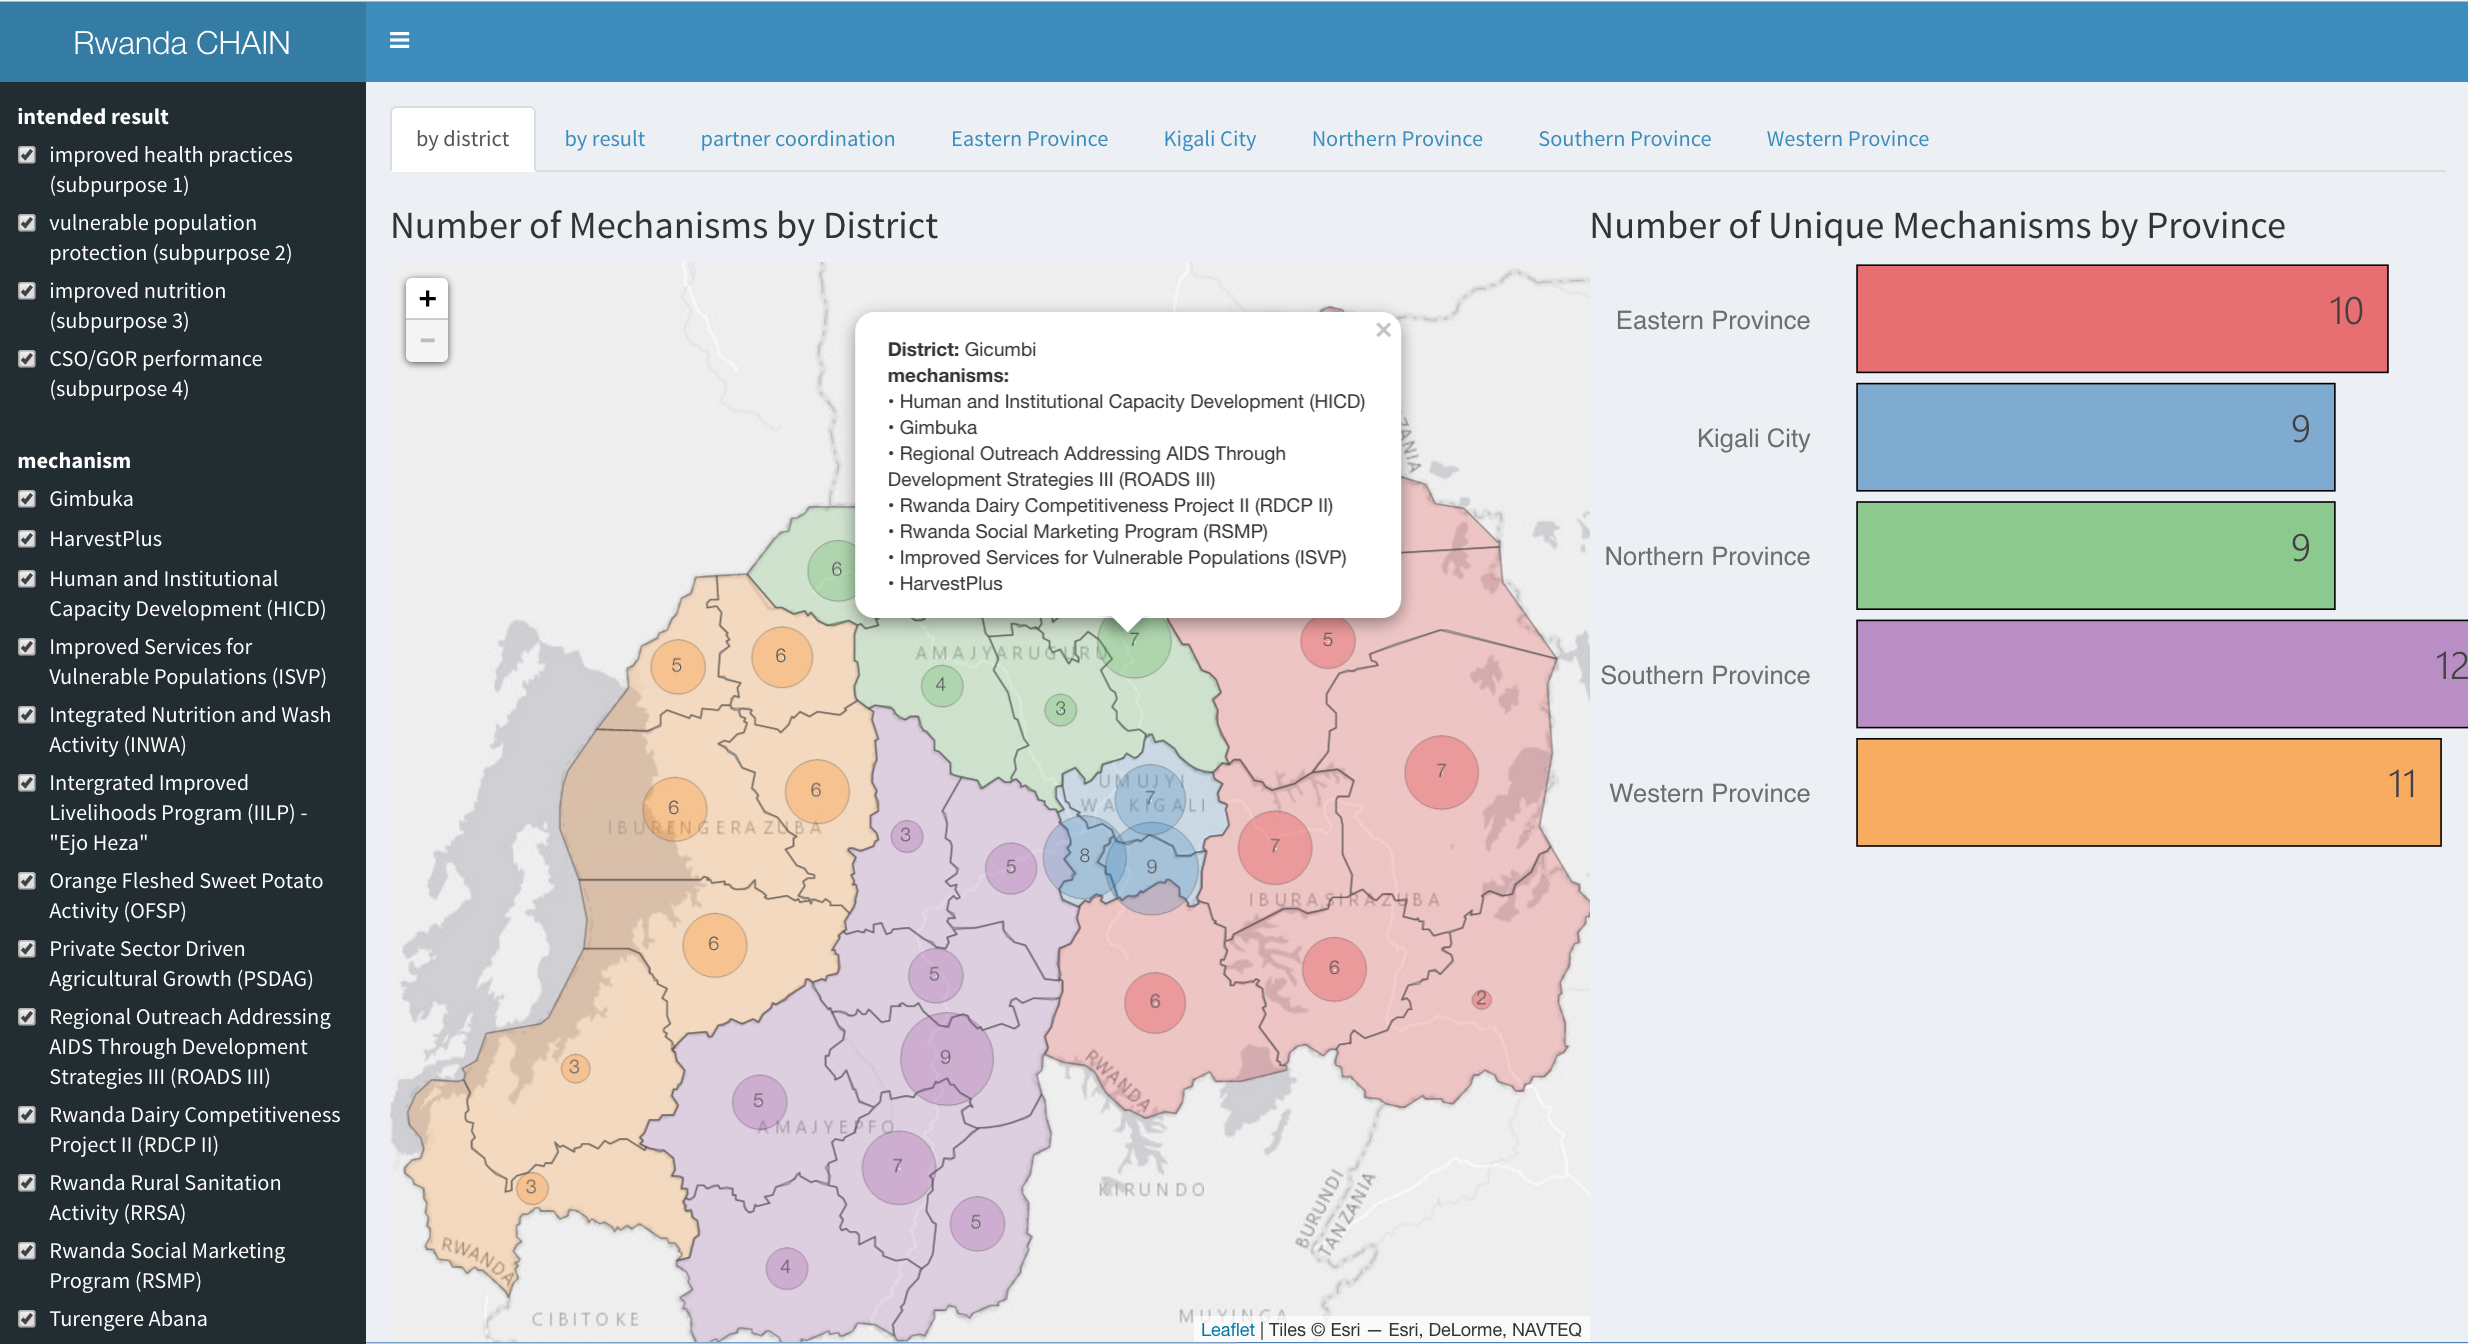
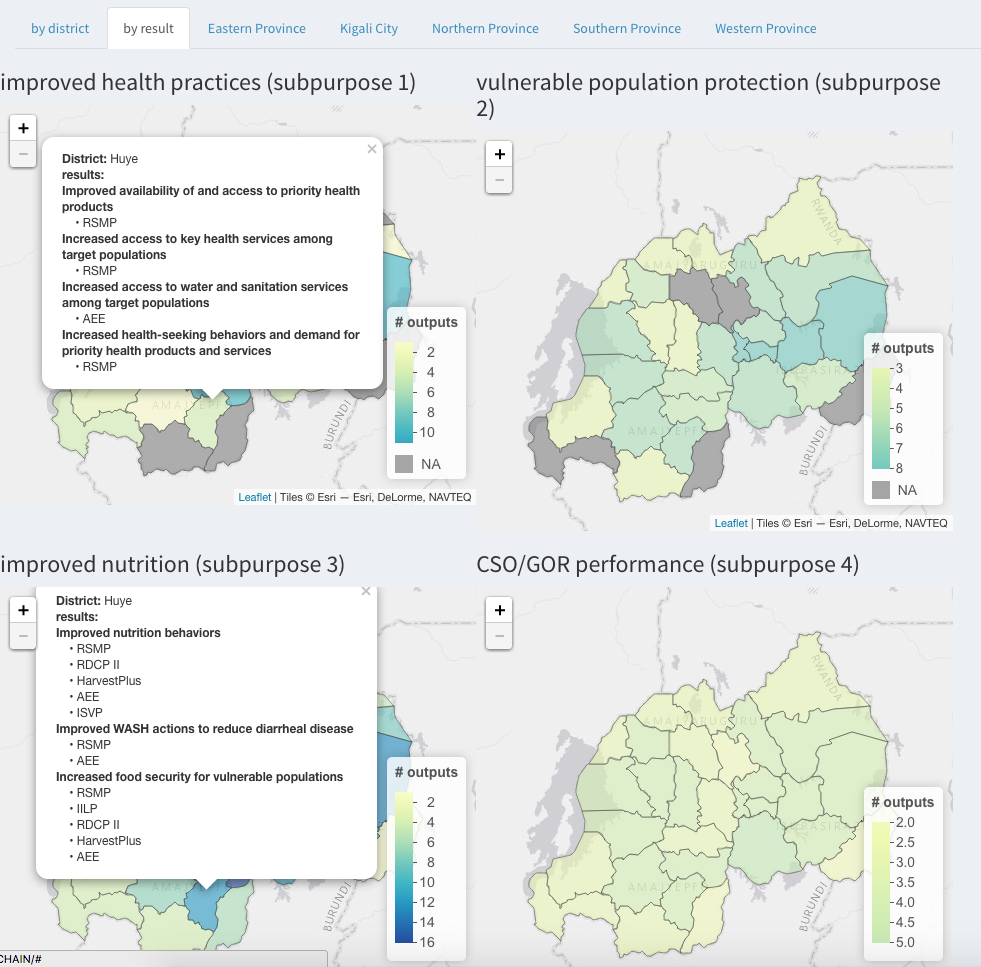
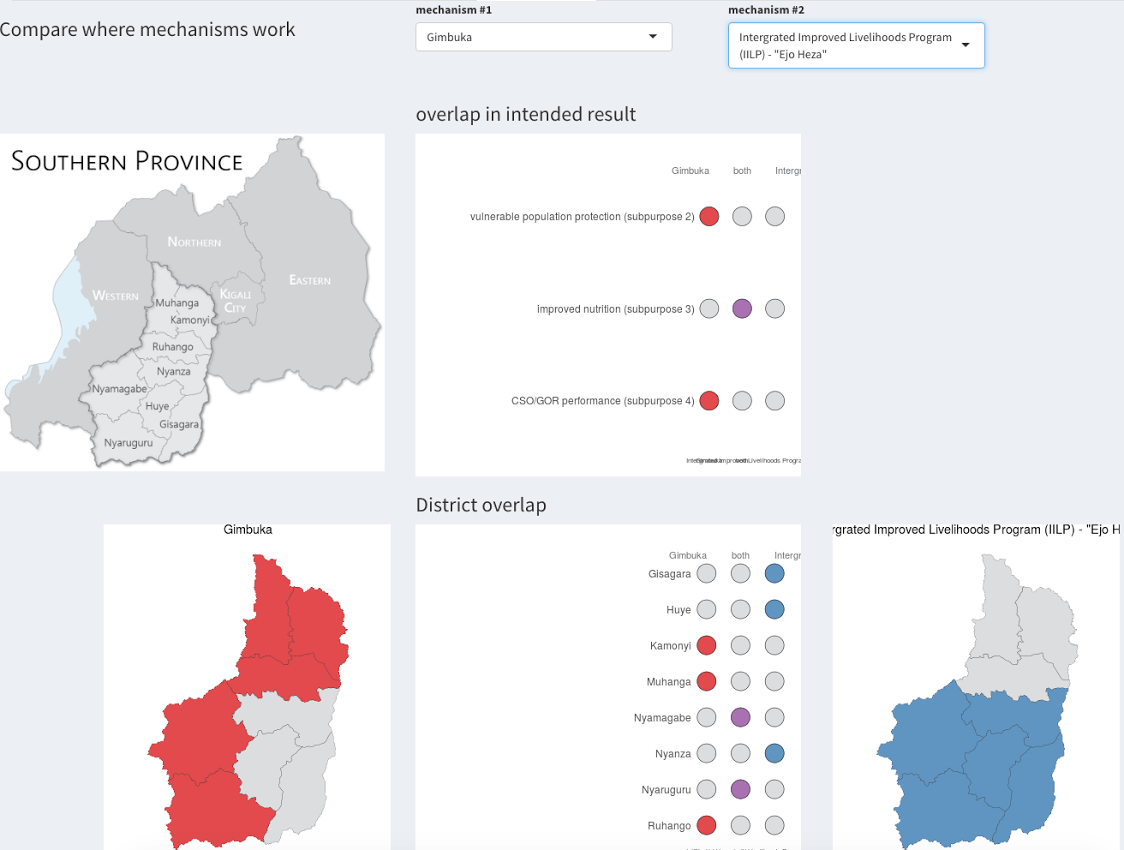
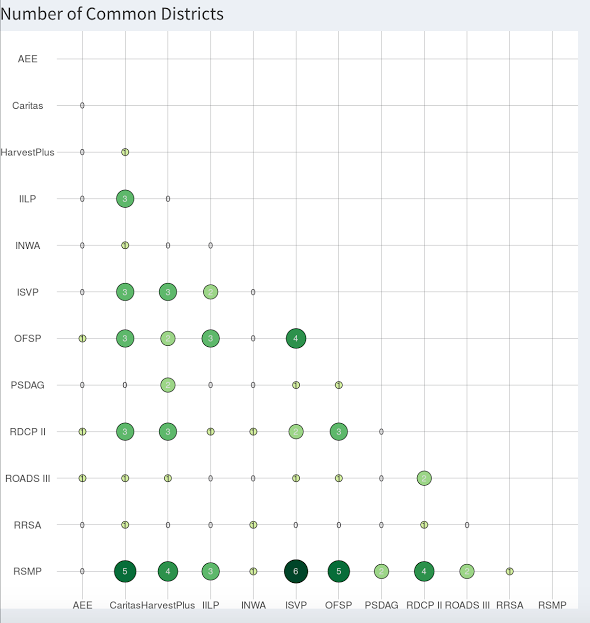
After collecting, cleaning, and georeferencing partner activity data, I built a customized Shiny dashboard to summarize coordination patterns. Users are allowed to view projects by partners, filter based on topic area or partner, and find partners working on a similar topic area or in a similar geographic area of Rwanda.
The visualizations are being used as a demo site for an on-going project to improve partner coordination. Based on user feedback, we are designing a platform to collect and visualize more geographically detailed data. The new site adds additional functionality allowing users to input, analyze, visualize and prioritize ongoing and future activities.
View the demo site