A customized R package to create reproducible plots, primarily with the
ggplot2 package. Designed for analysis of international
development data, some functions are highly specialized for the analysis and visualization
of household-level surveys. Others are more broadly extendable.
Install devtools by running
Then install the llamar library:
Then you're all set to use the library. Functions with example outputs are provided below. Full documentation is available within the package; type
Installation
Installation requires the devtools package.Install devtools by running
install.packages('devtools') at the console.
Then install the llamar library:
library('devtools')
install_github('flaneuse/llamar')
library('llamar')
Then you're all set to use the library. Functions with example outputs are provided below. Full documentation is available within the package; type
?llamar::plot_coef at the console.
Visualization Functions
-
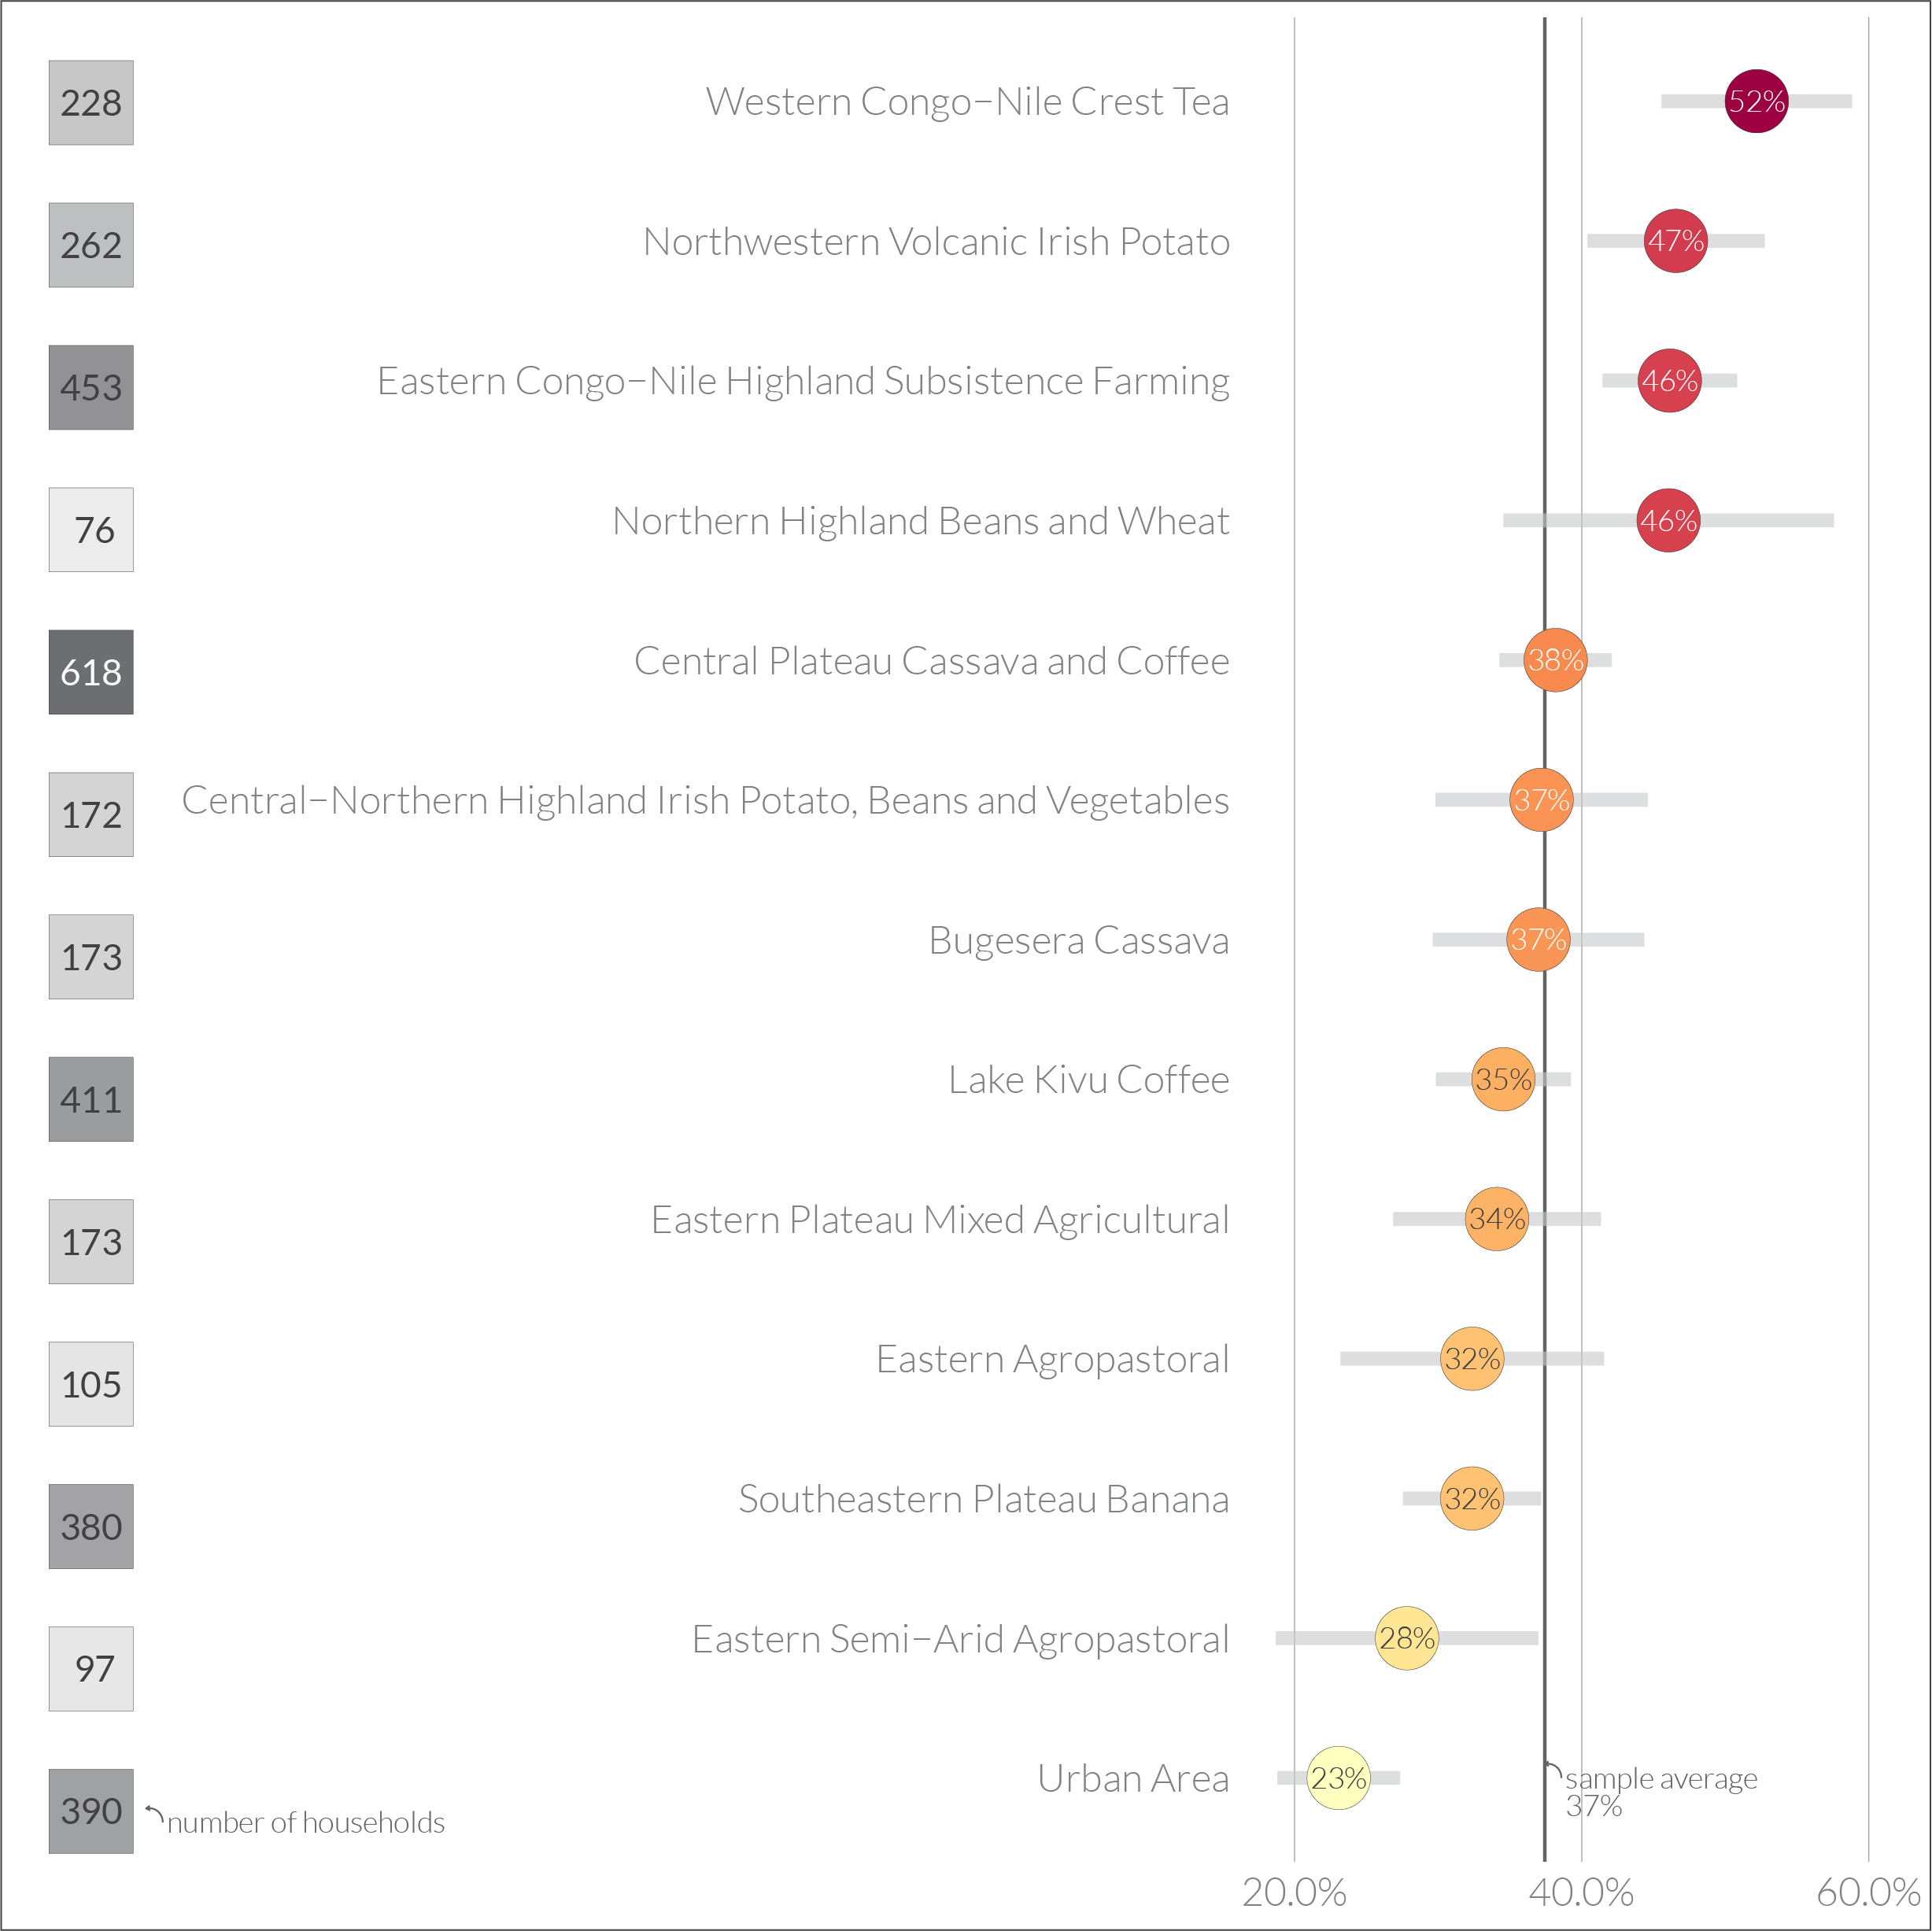 plot_avg_dot
: calculate average and create a dot plot
plot_avg_dot
: calculate average and create a dot plot
-
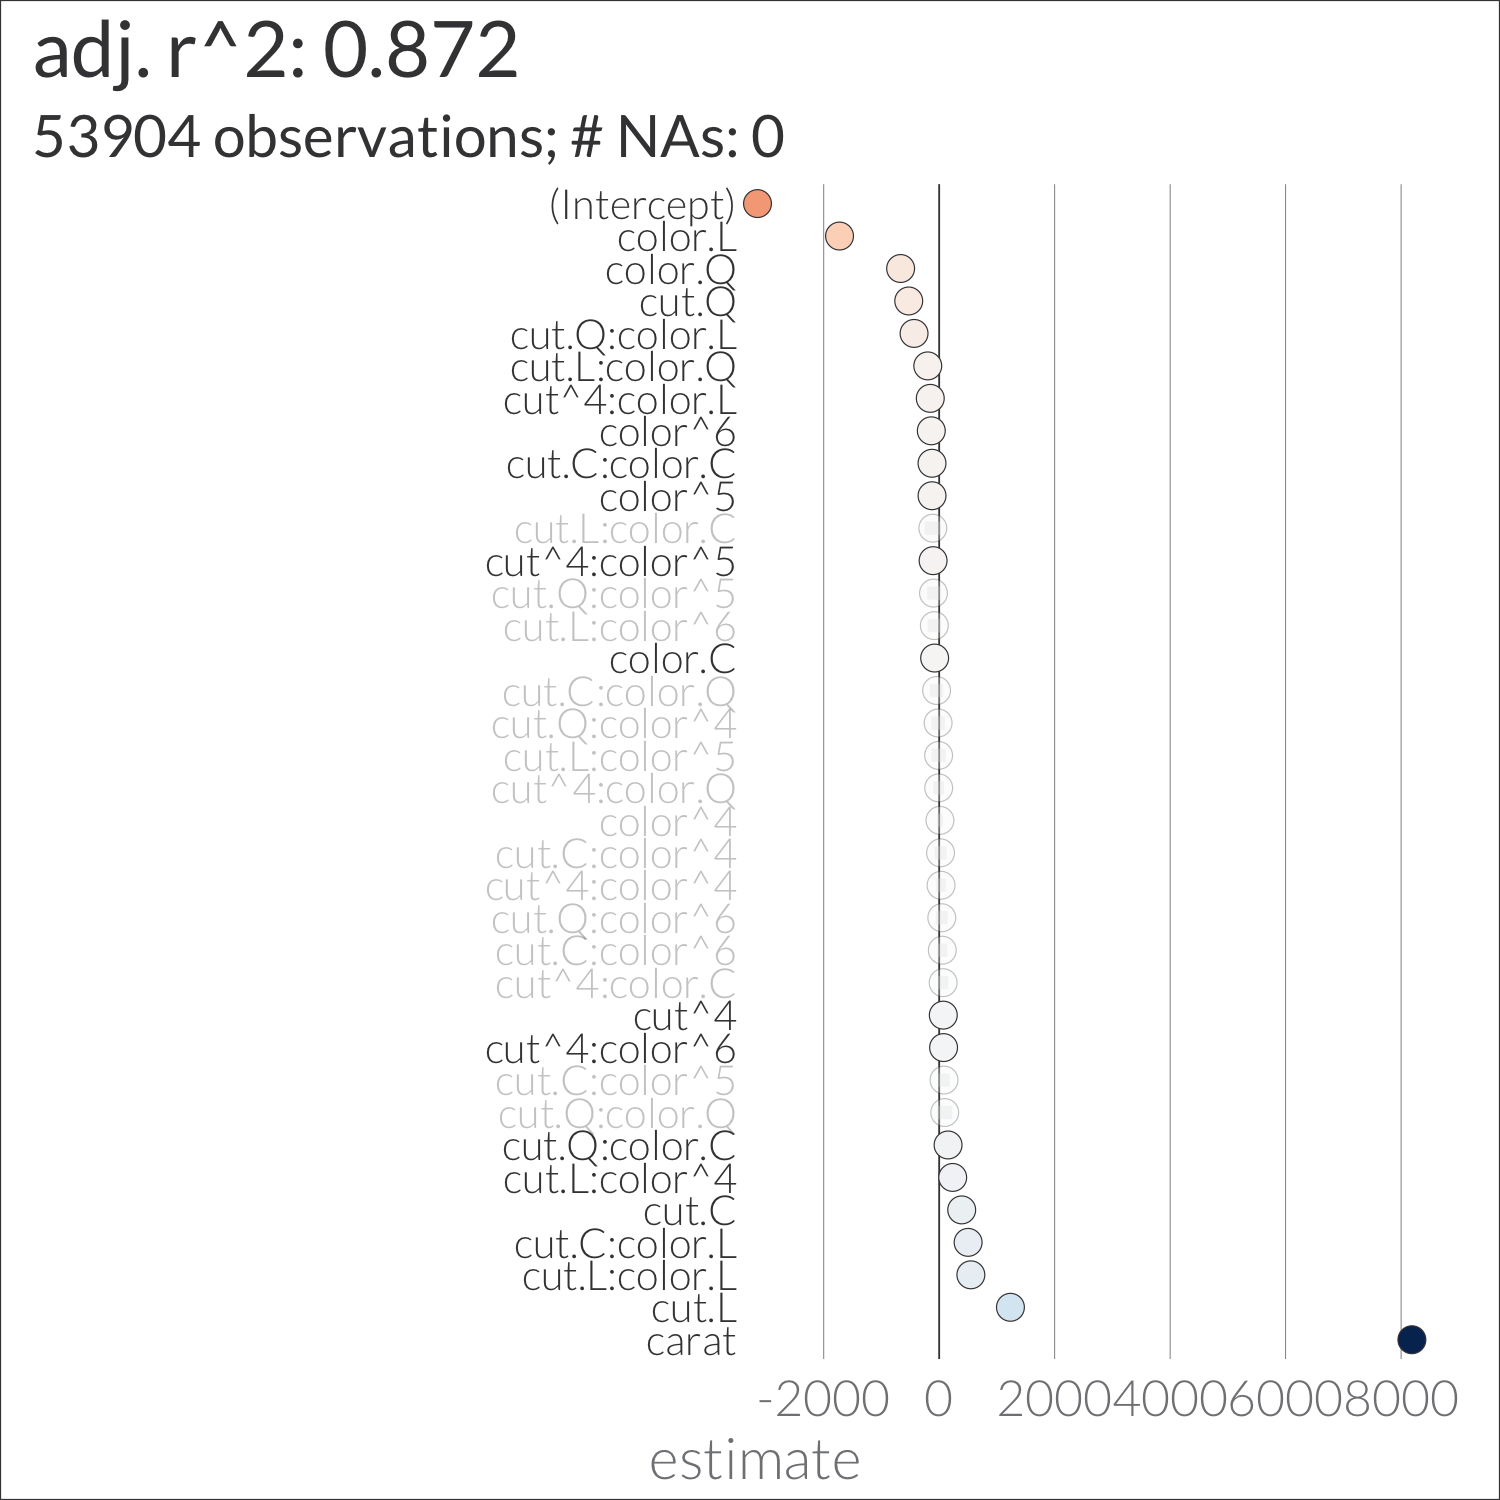 plot_coef
: plot regression coefficients
plot_coef
: plot regression coefficients
-
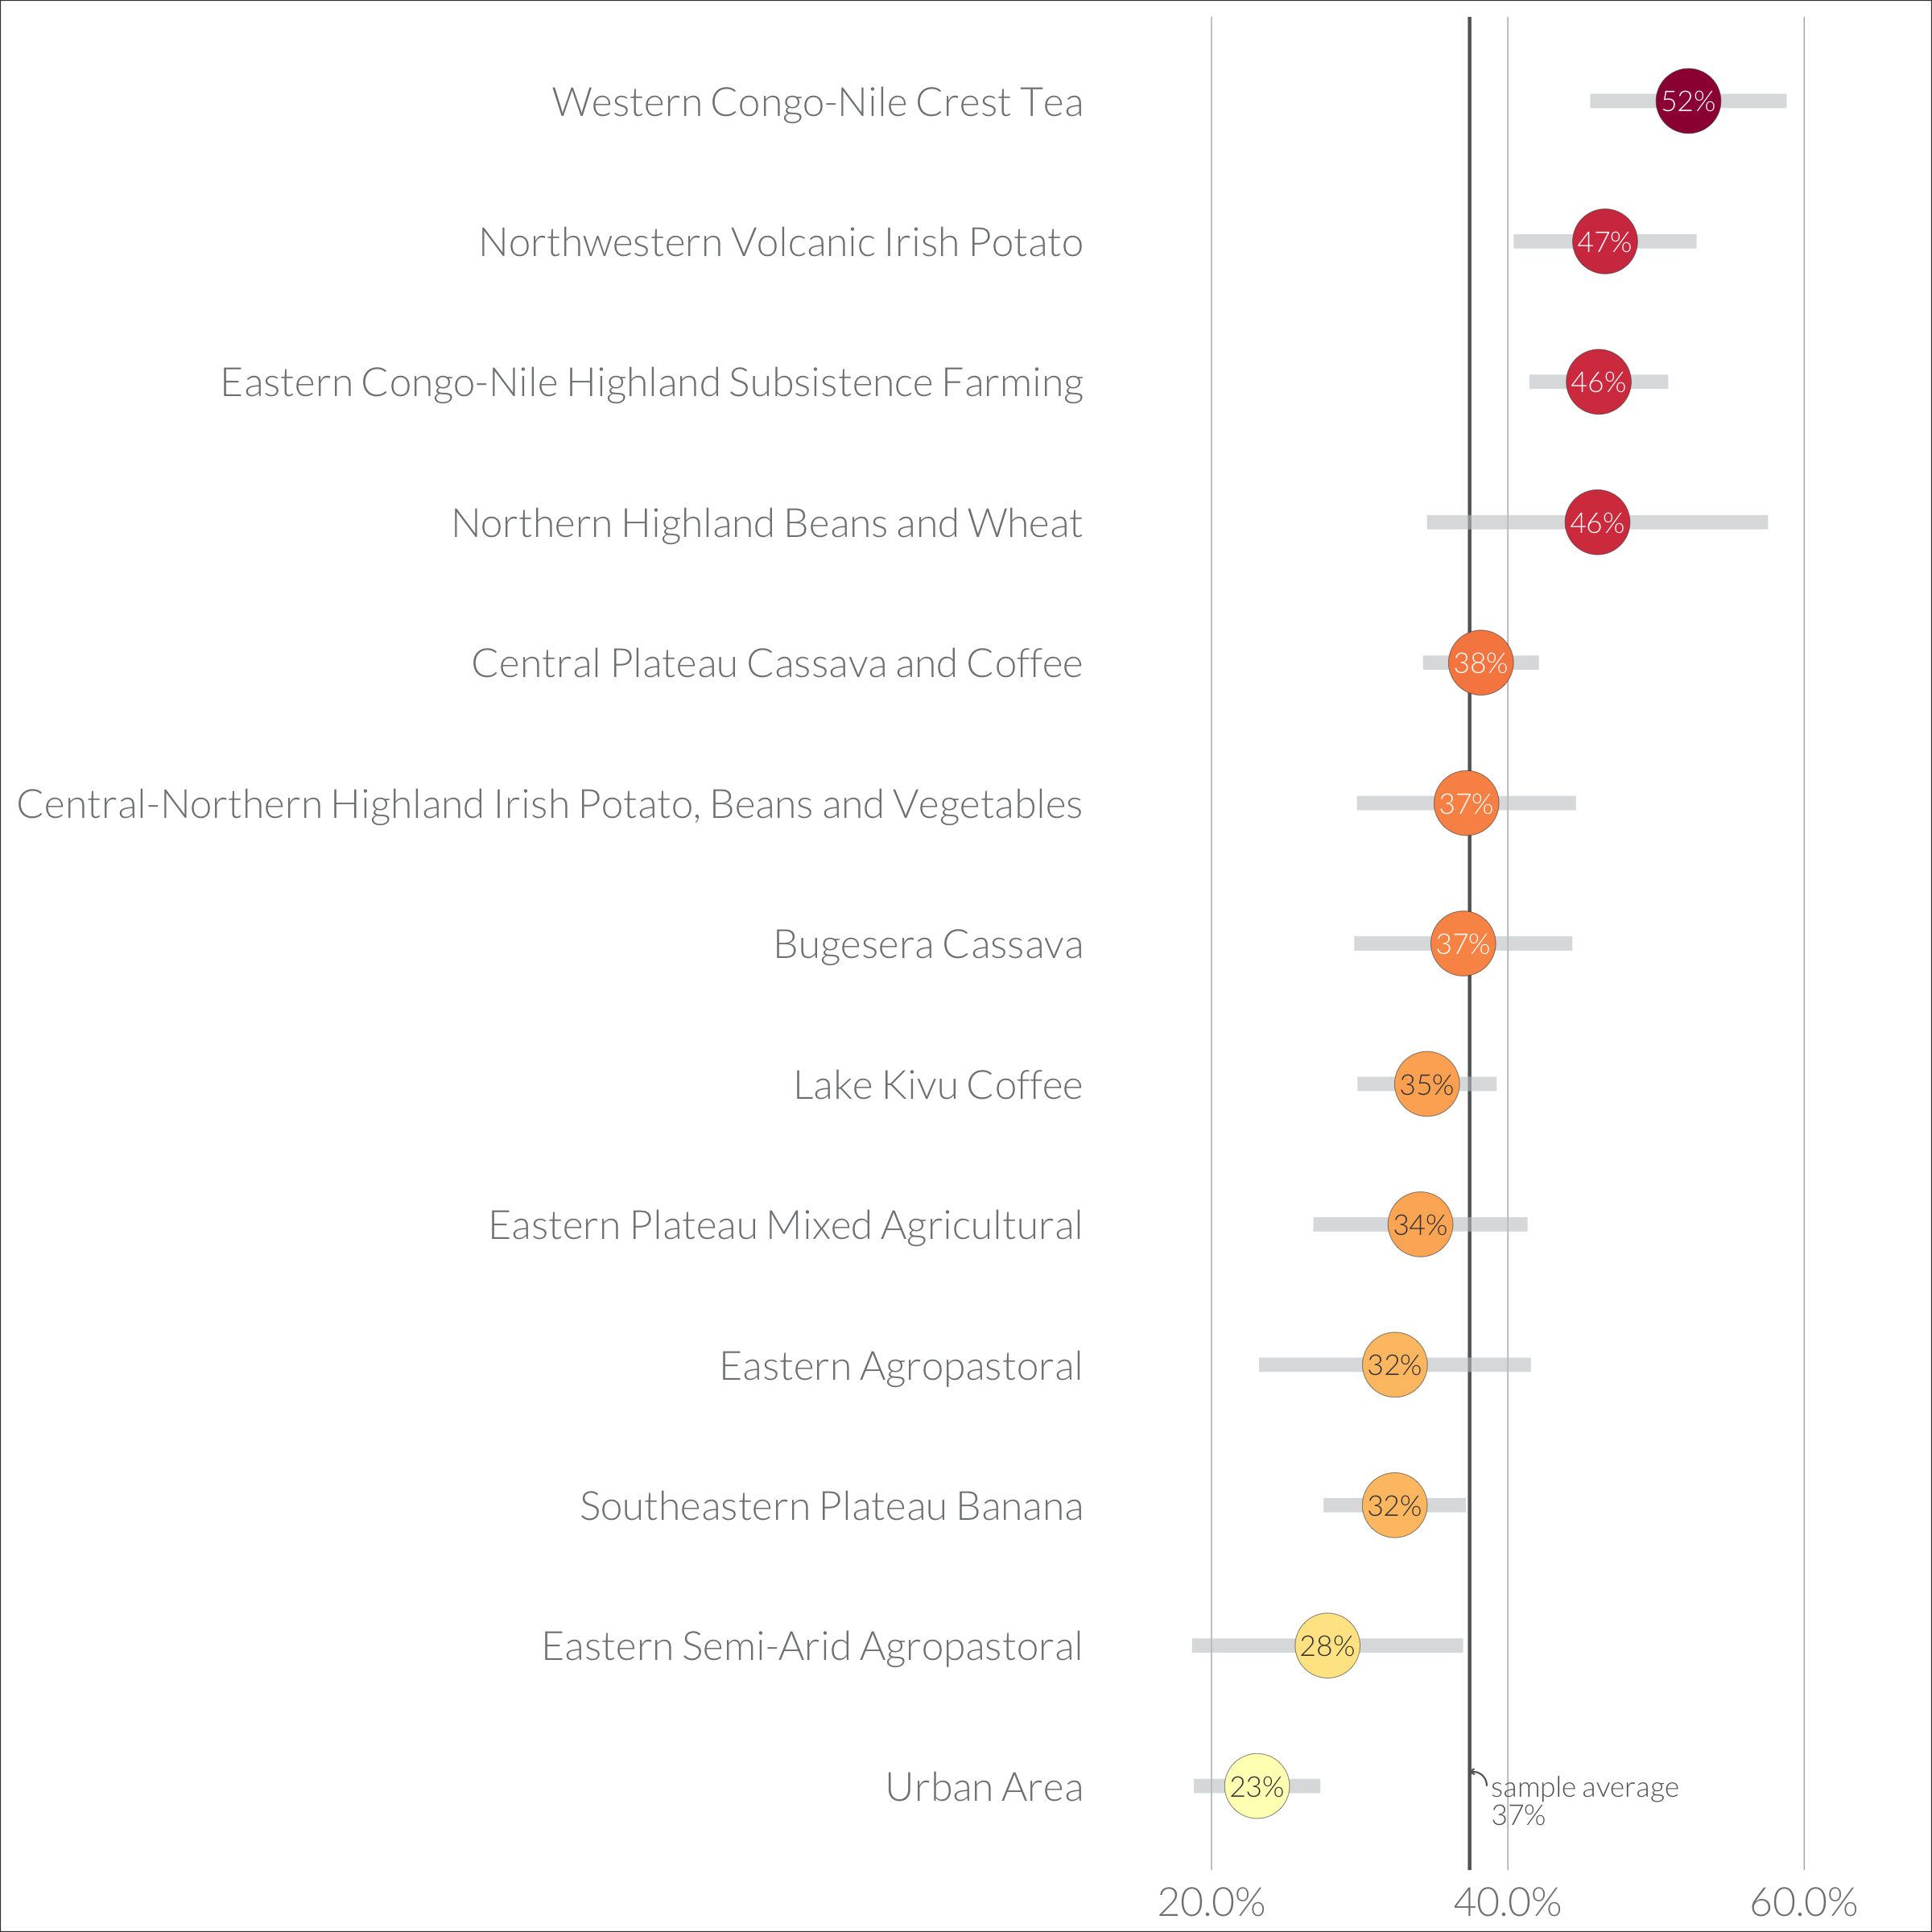 plot_dot (dot)
: create a dot plot or lollipop plot
plot_dot (dot)
: create a dot plot or lollipop plot
-
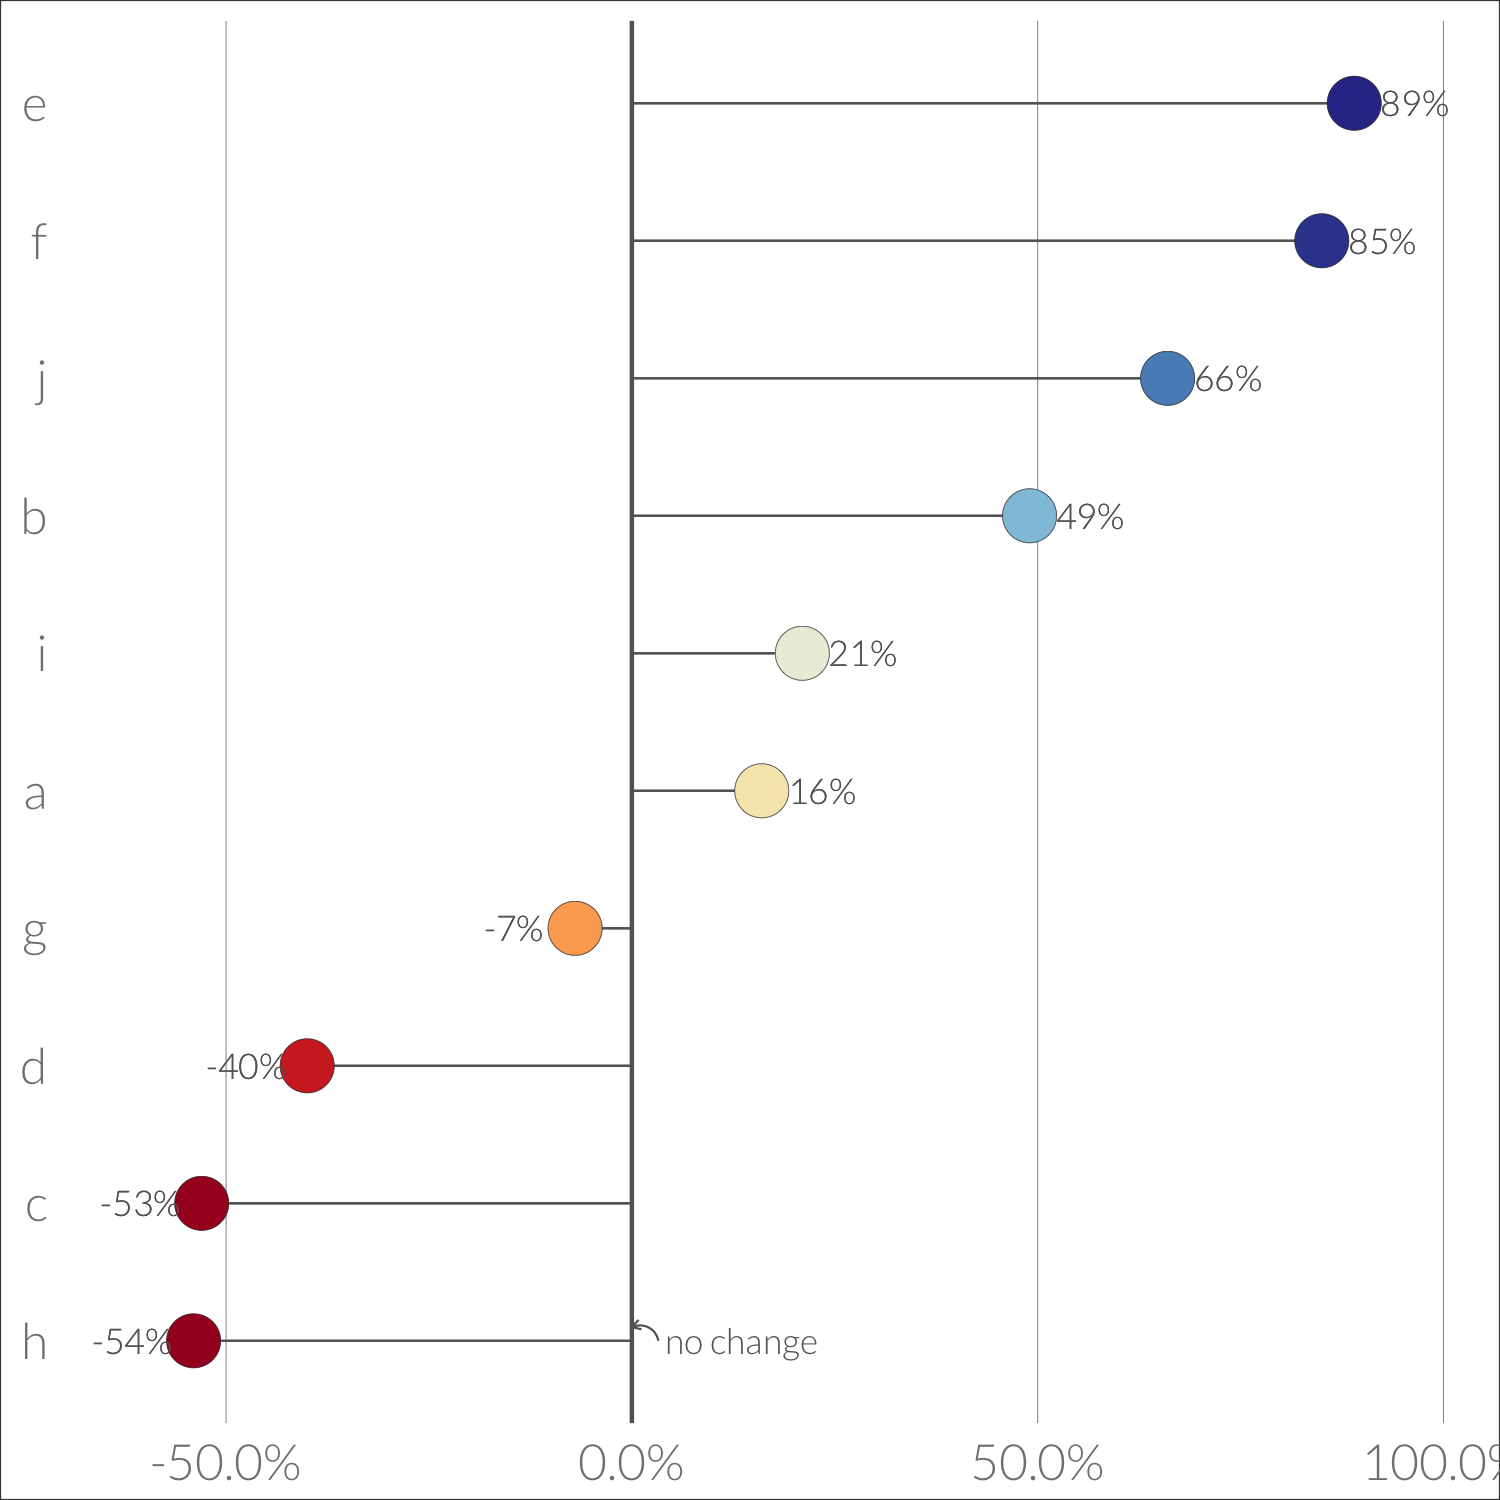 plot_dot (lollipop)
: create a dot plot or lollipop plot
plot_dot (lollipop)
: create a dot plot or lollipop plot
Visualization Themes
-
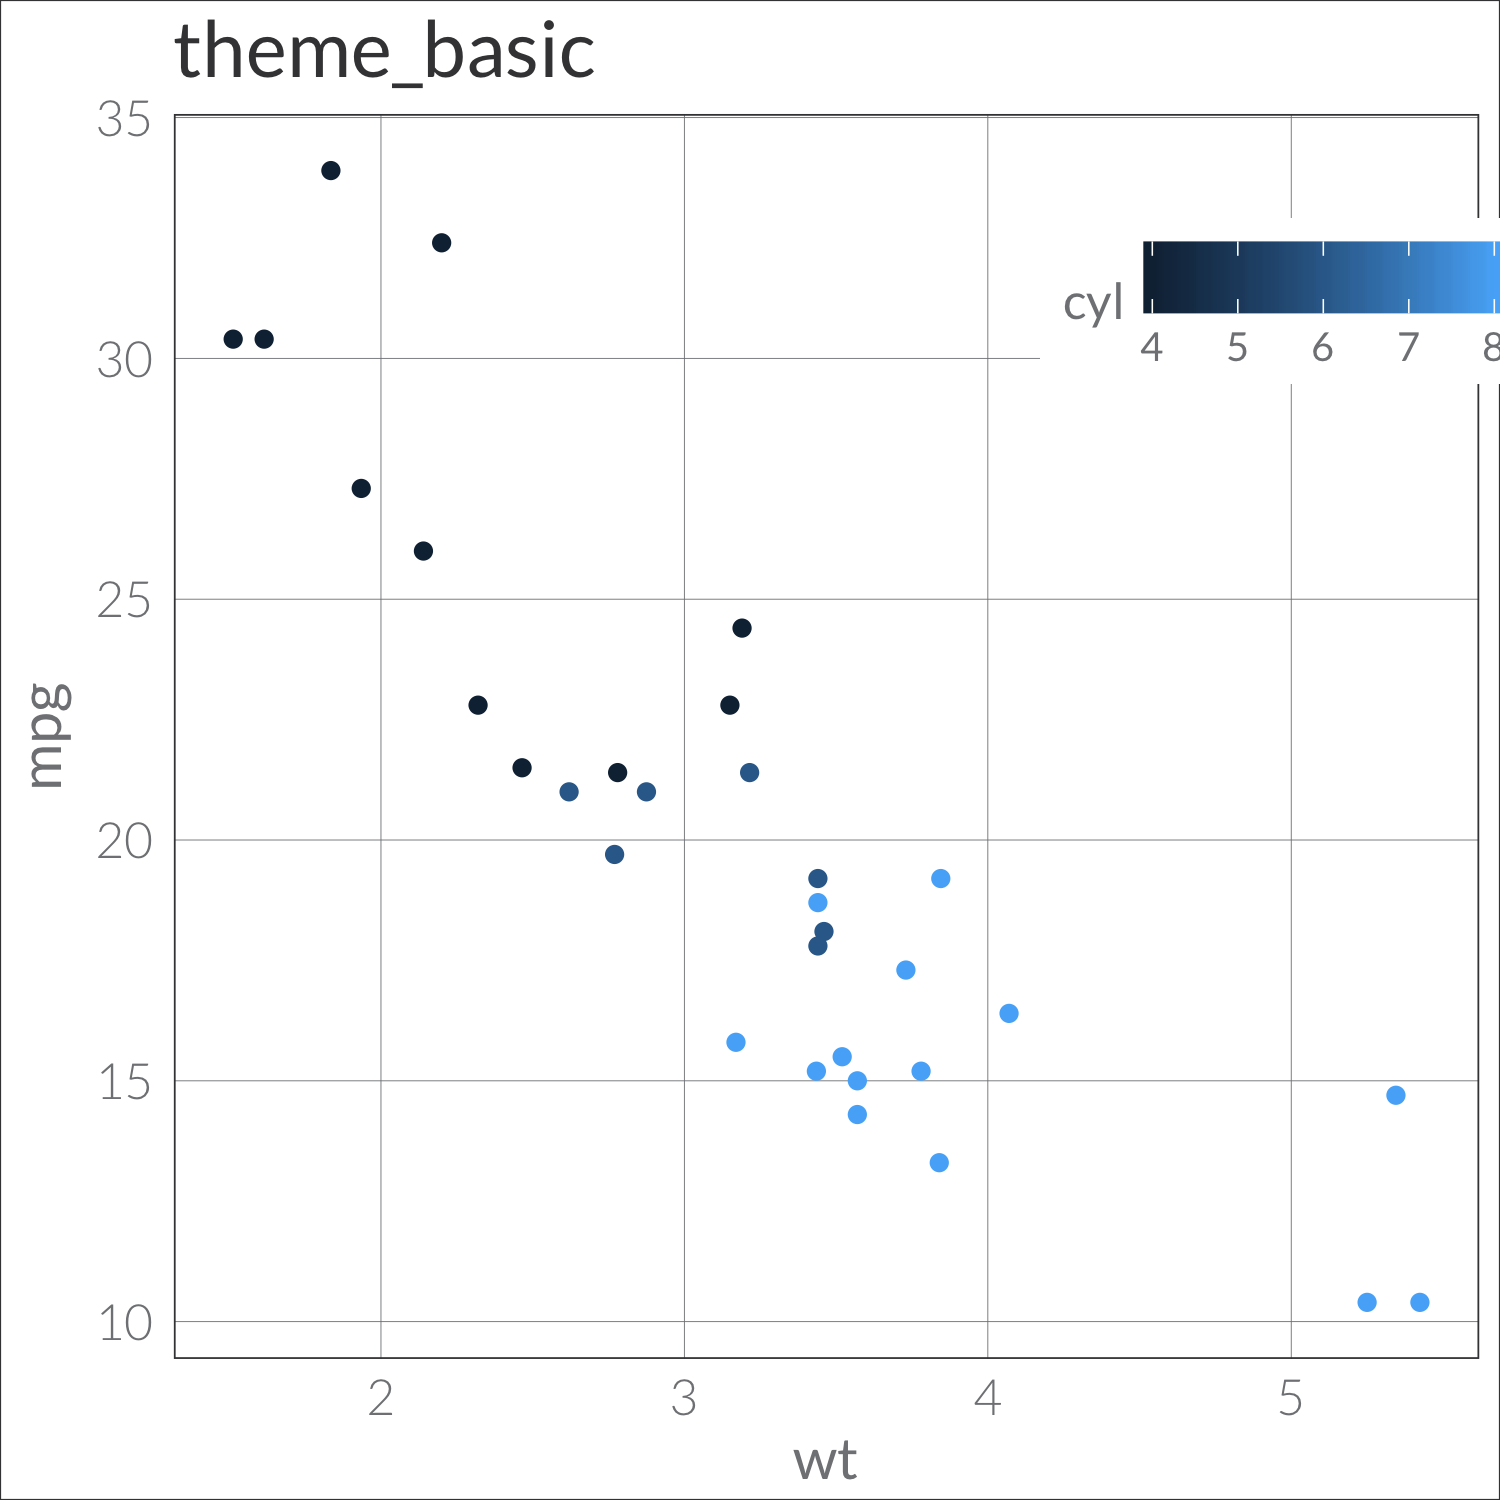 theme_basic
: x- and y-axis grid lines, labels, and titles plus default legend
theme_basic
: x- and y-axis grid lines, labels, and titles plus default legend
-
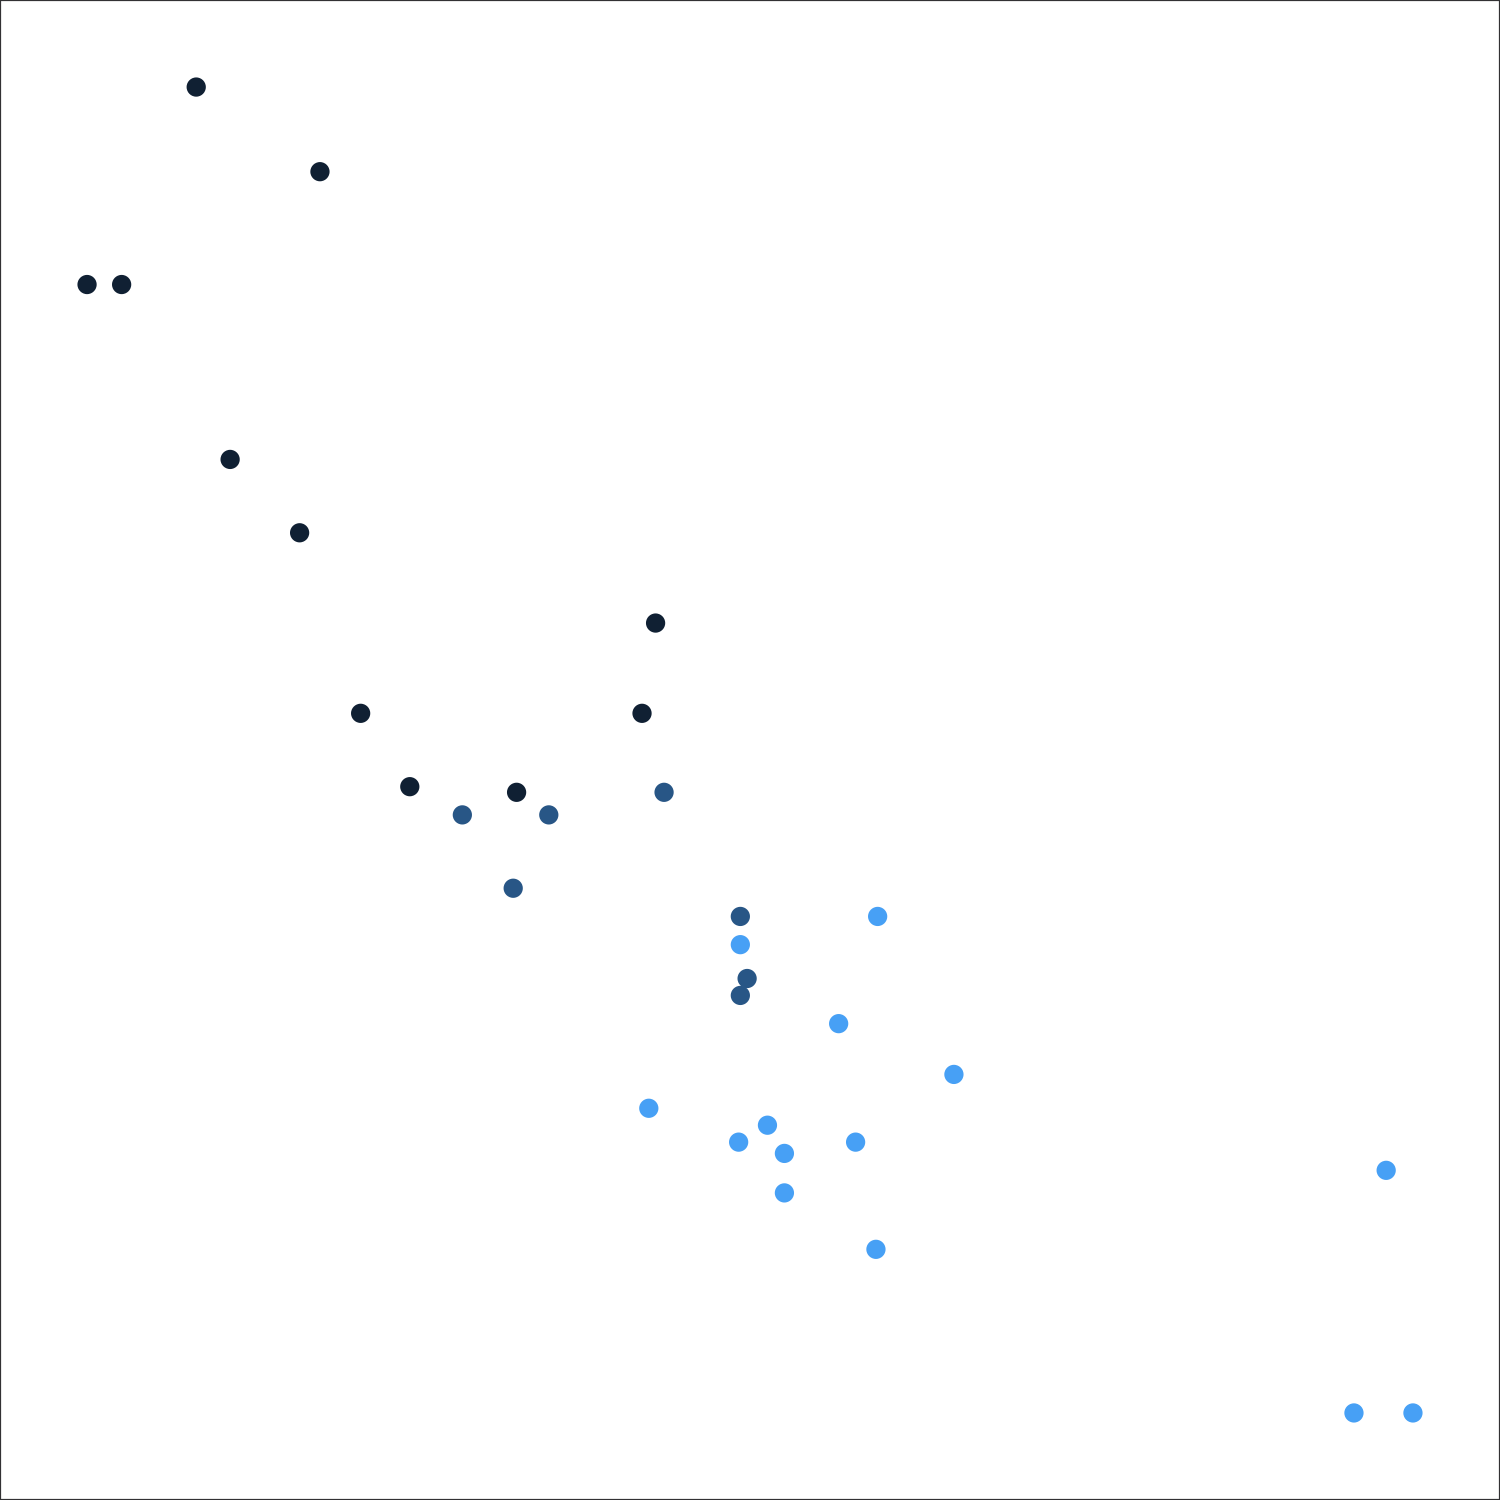 theme_blank
: completely blank theme
theme_blank
: completely blank theme
-
 theme_stroke
: adds grey stroke around edge
theme_stroke
: adds grey stroke around edge
-
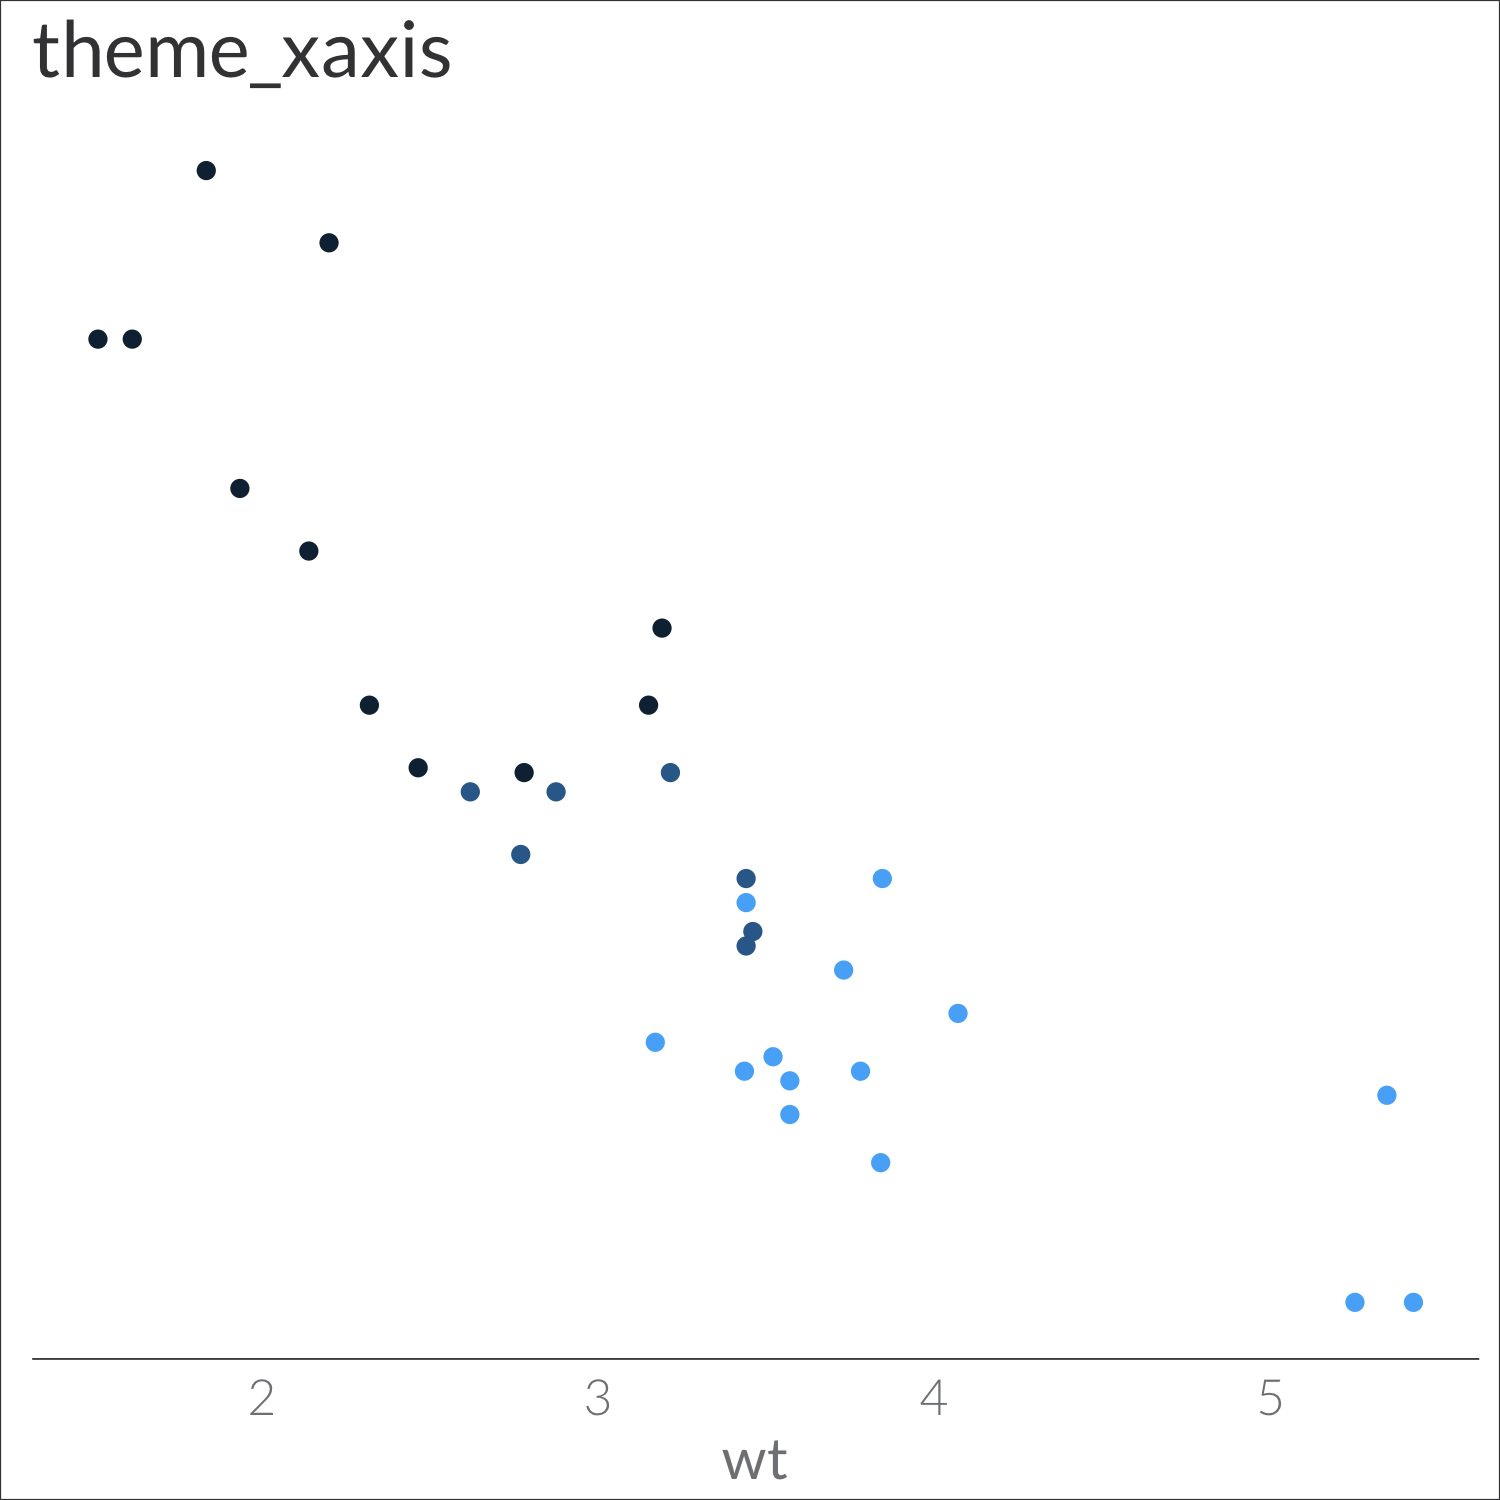 theme_xaxis
: x labels, x title, and x-axis line; no gridlines
theme_xaxis
: x labels, x title, and x-axis line; no gridlines
-
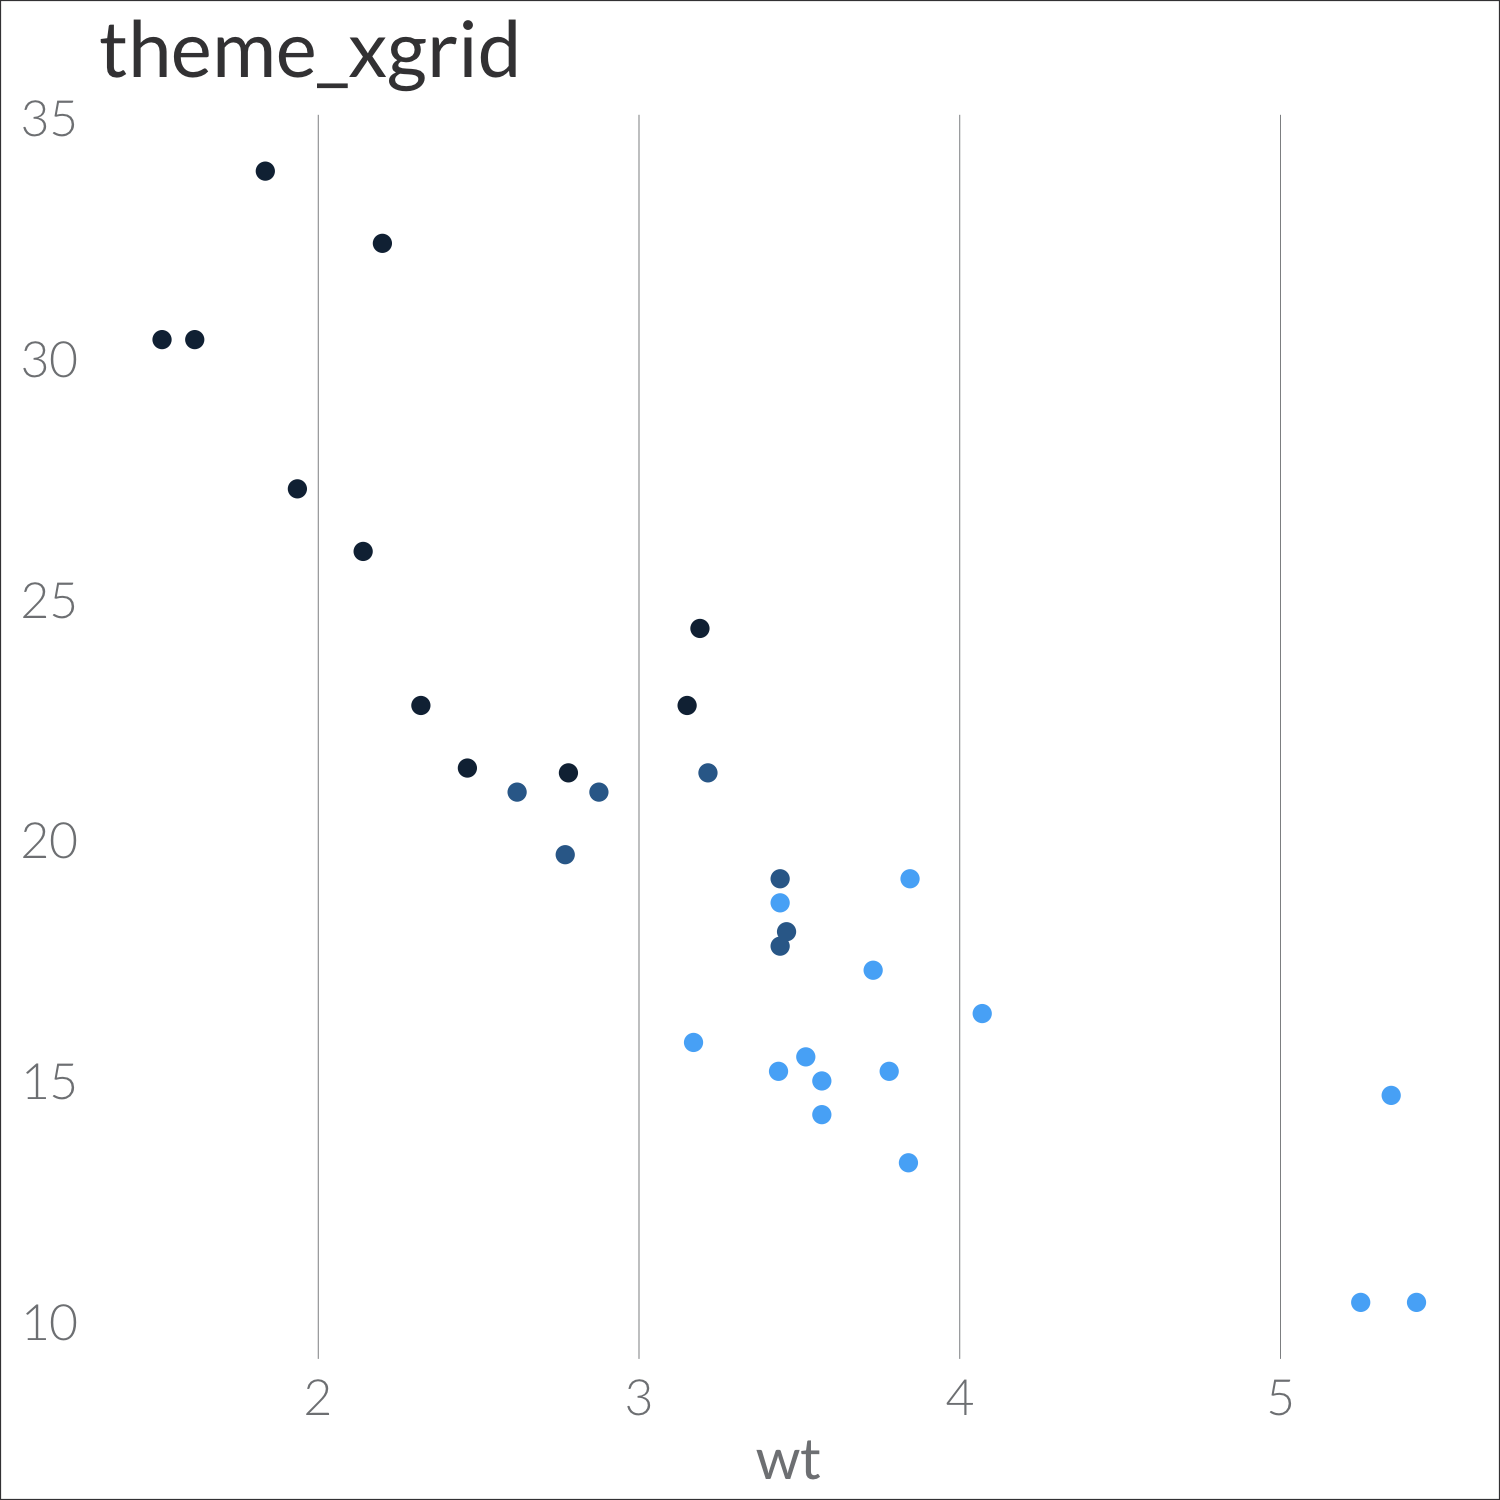 theme_xgrid
: x-grid lines, x- and y-axis labels, and x-axis title
theme_xgrid
: x-grid lines, x- and y-axis labels, and x-axis title
-
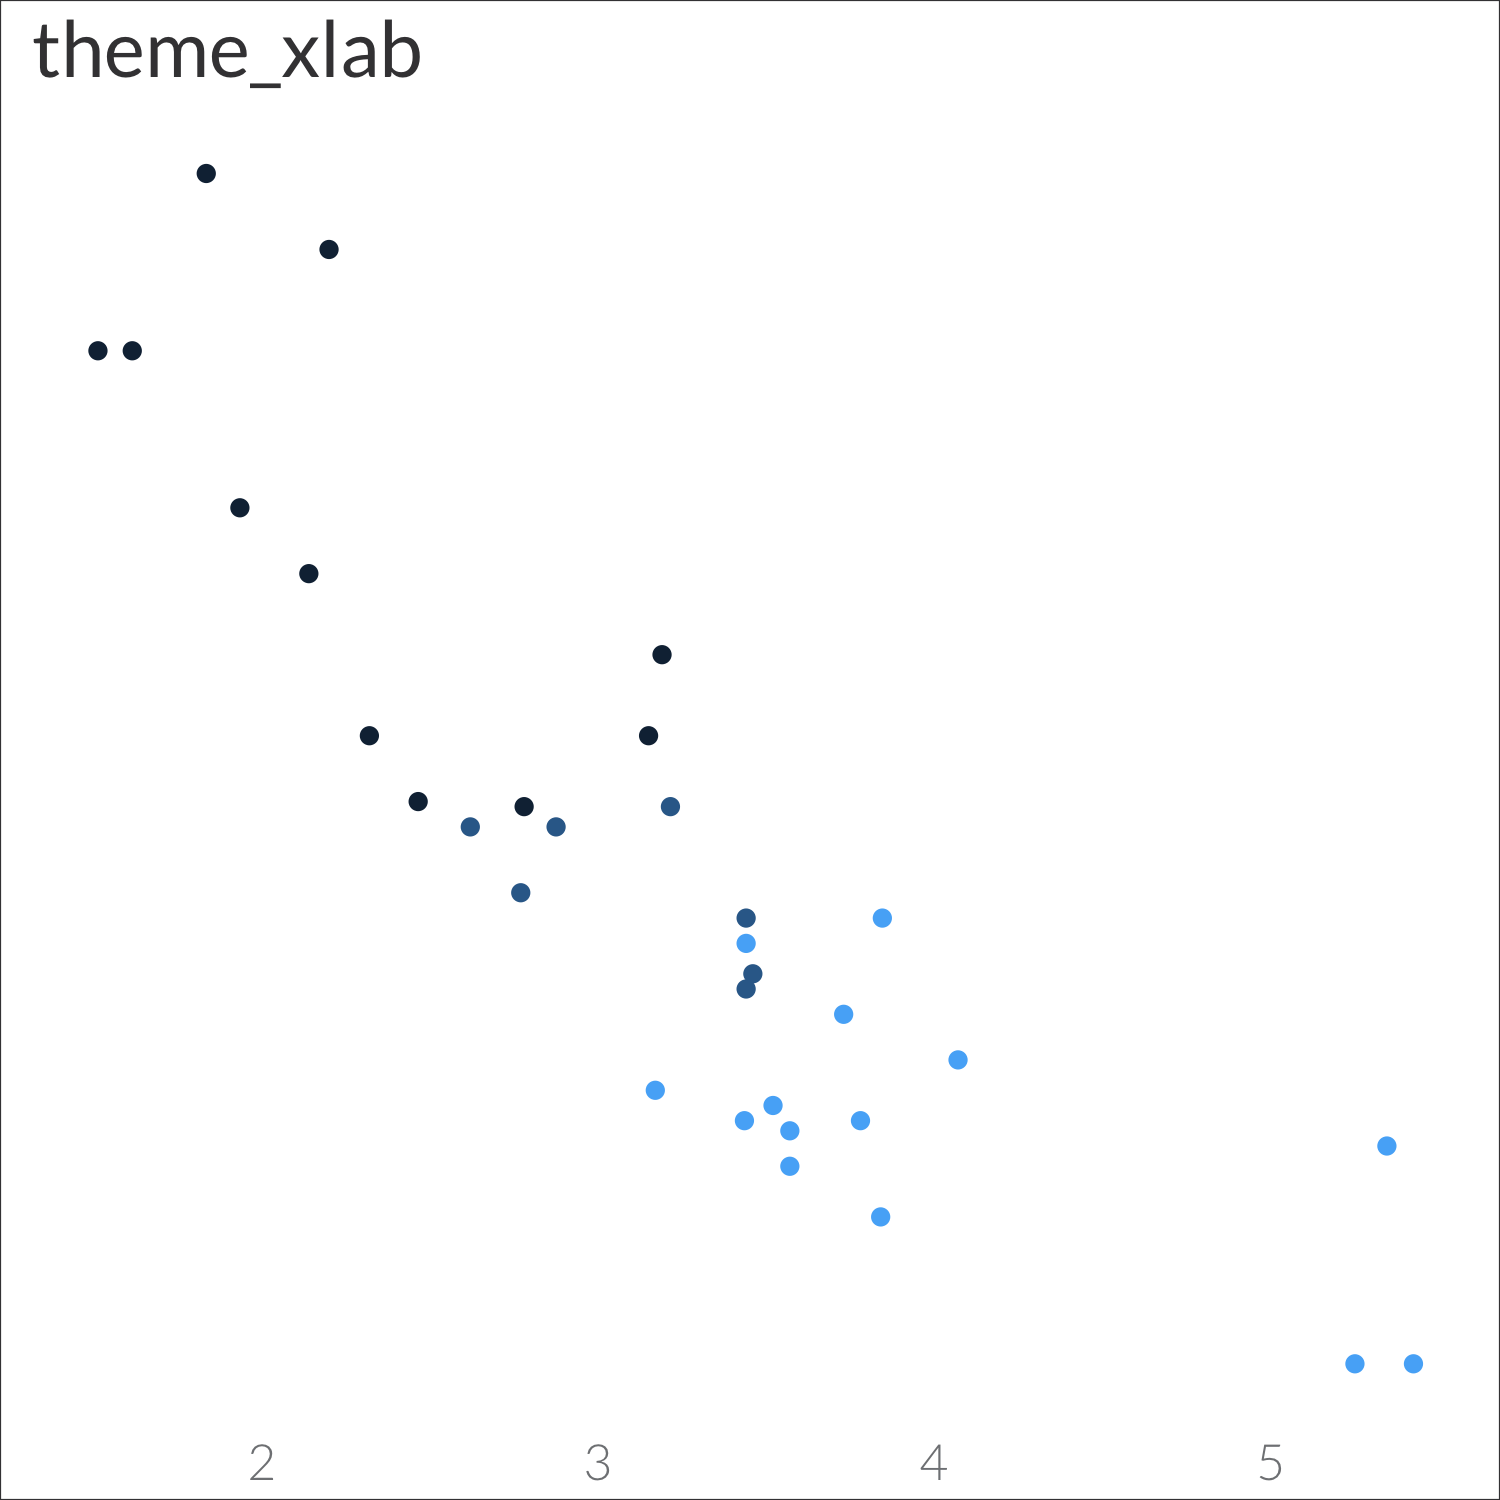 theme_xlab
: x-axis labels; no gridlines
theme_xlab
: x-axis labels; no gridlines
-
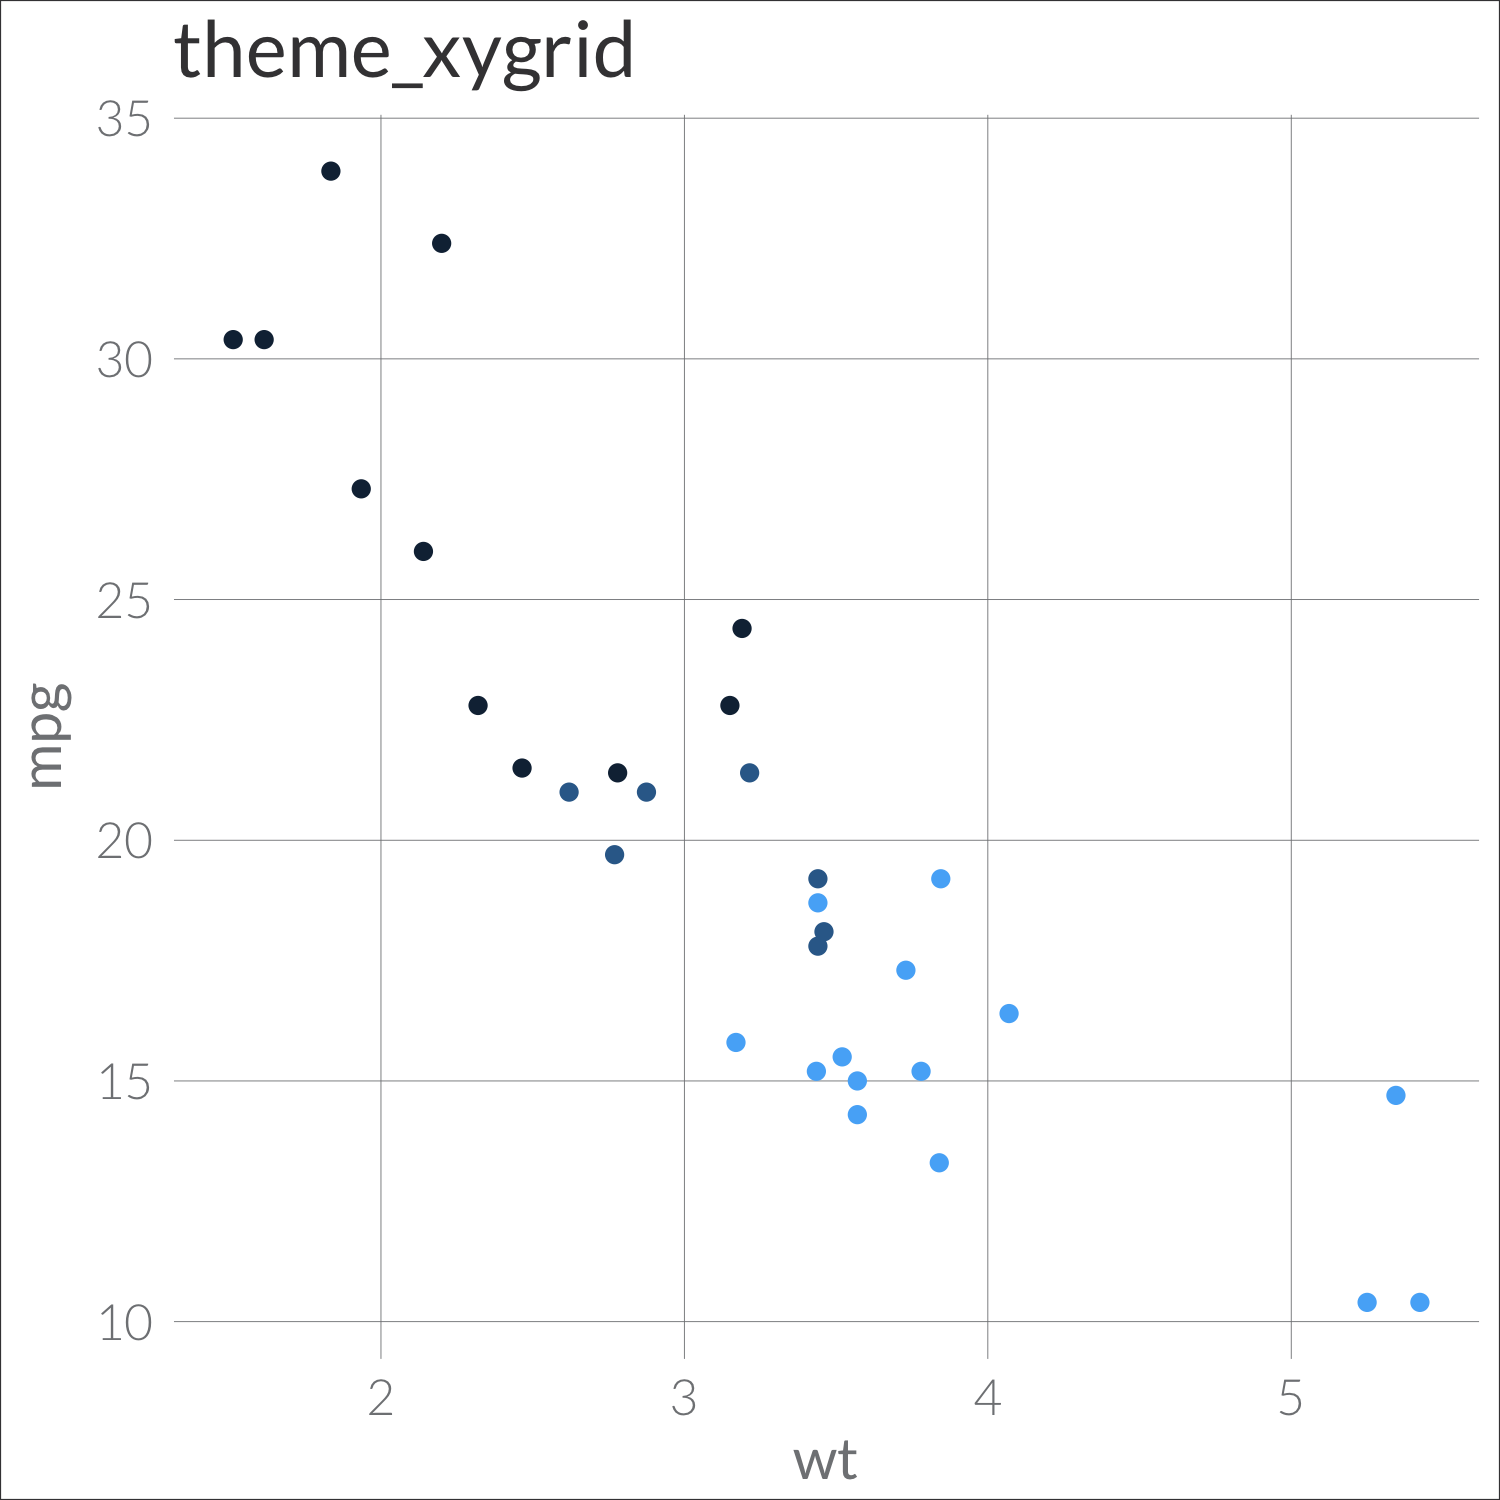 theme_xygrid
: x- and y-axis grid lines, labels, and titles
theme_xygrid
: x- and y-axis grid lines, labels, and titles
-
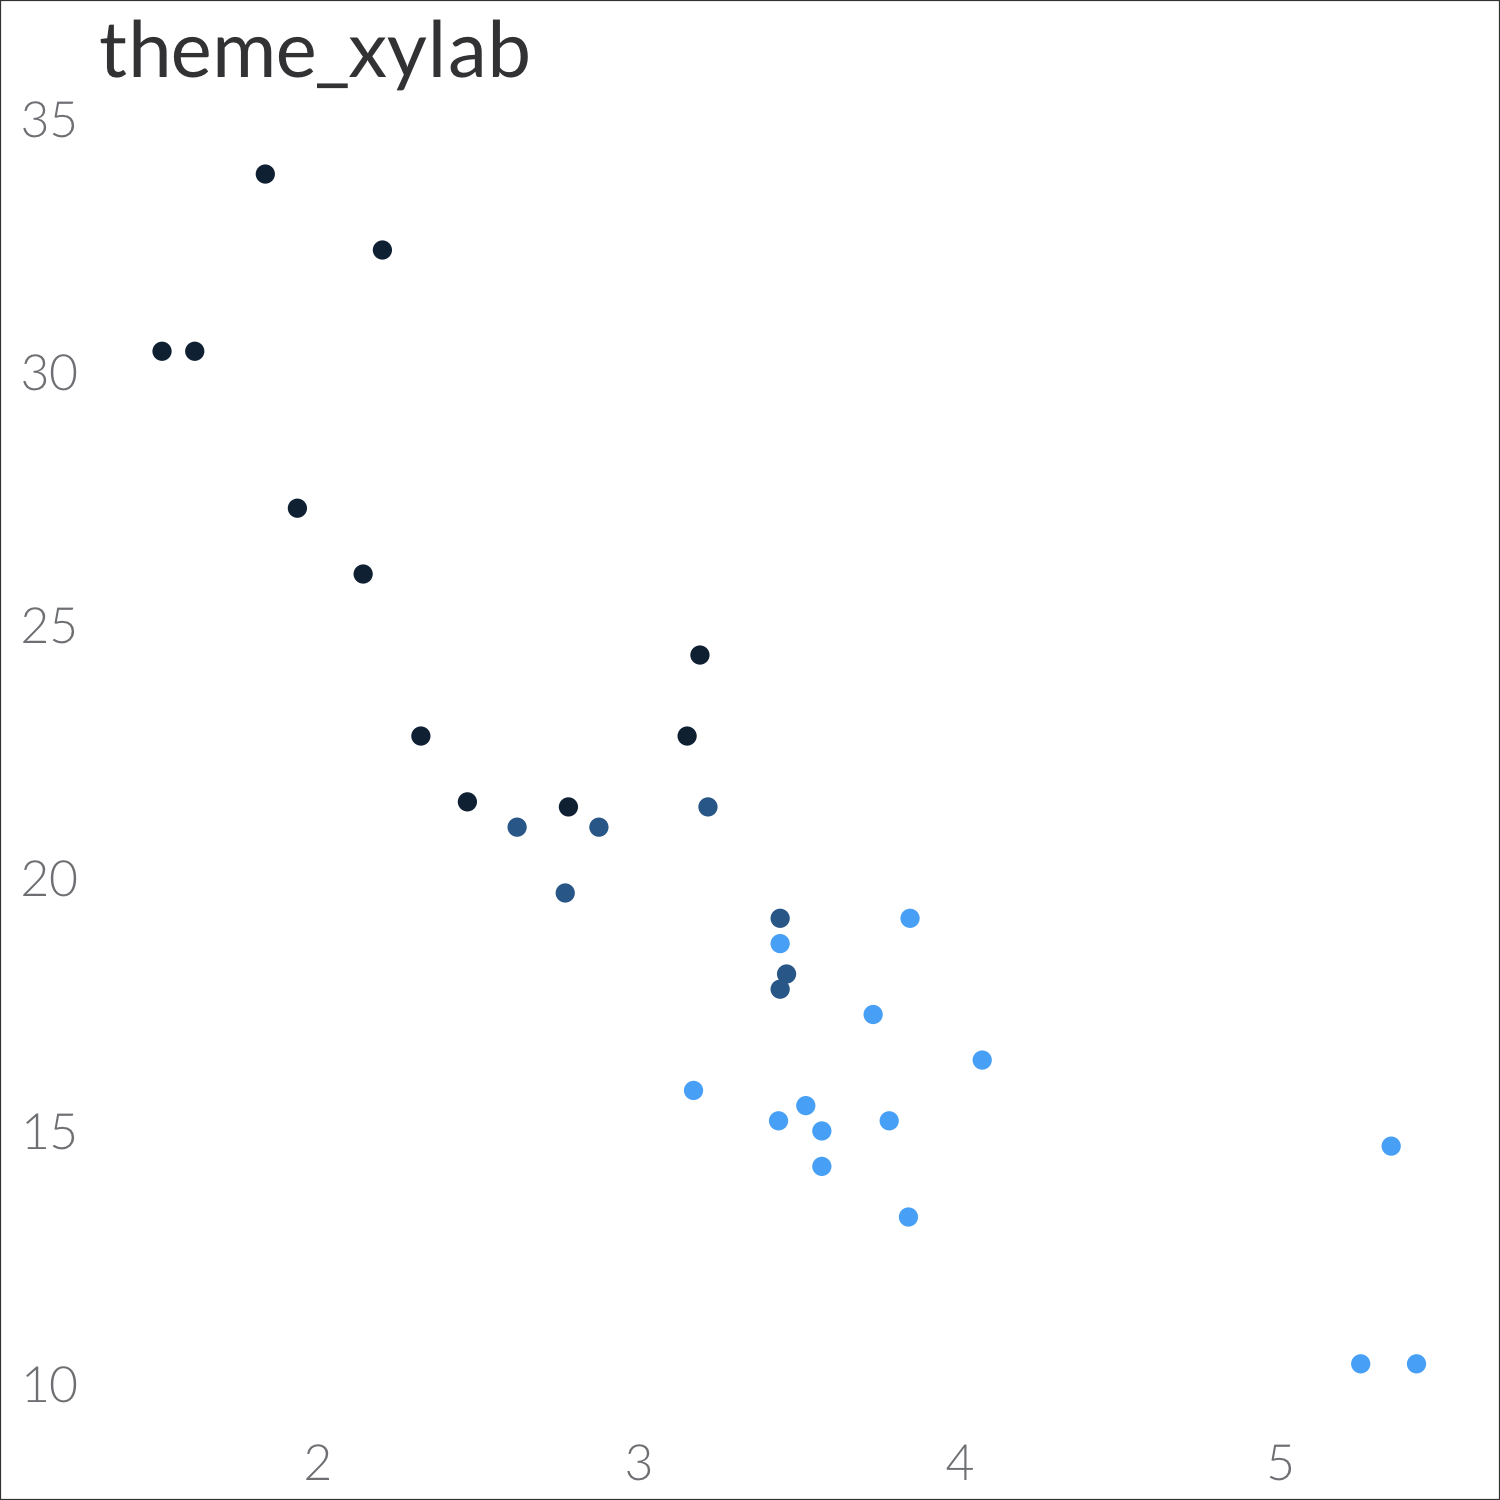 theme_xylab
: light x-grid lines, x and y axis labels, and x-axis title
theme_xylab
: light x-grid lines, x and y axis labels, and x-axis title
-
 theme_yaxis
: y labels, titles, and y-axis line; no gridlines
theme_yaxis
: y labels, titles, and y-axis line; no gridlines
-
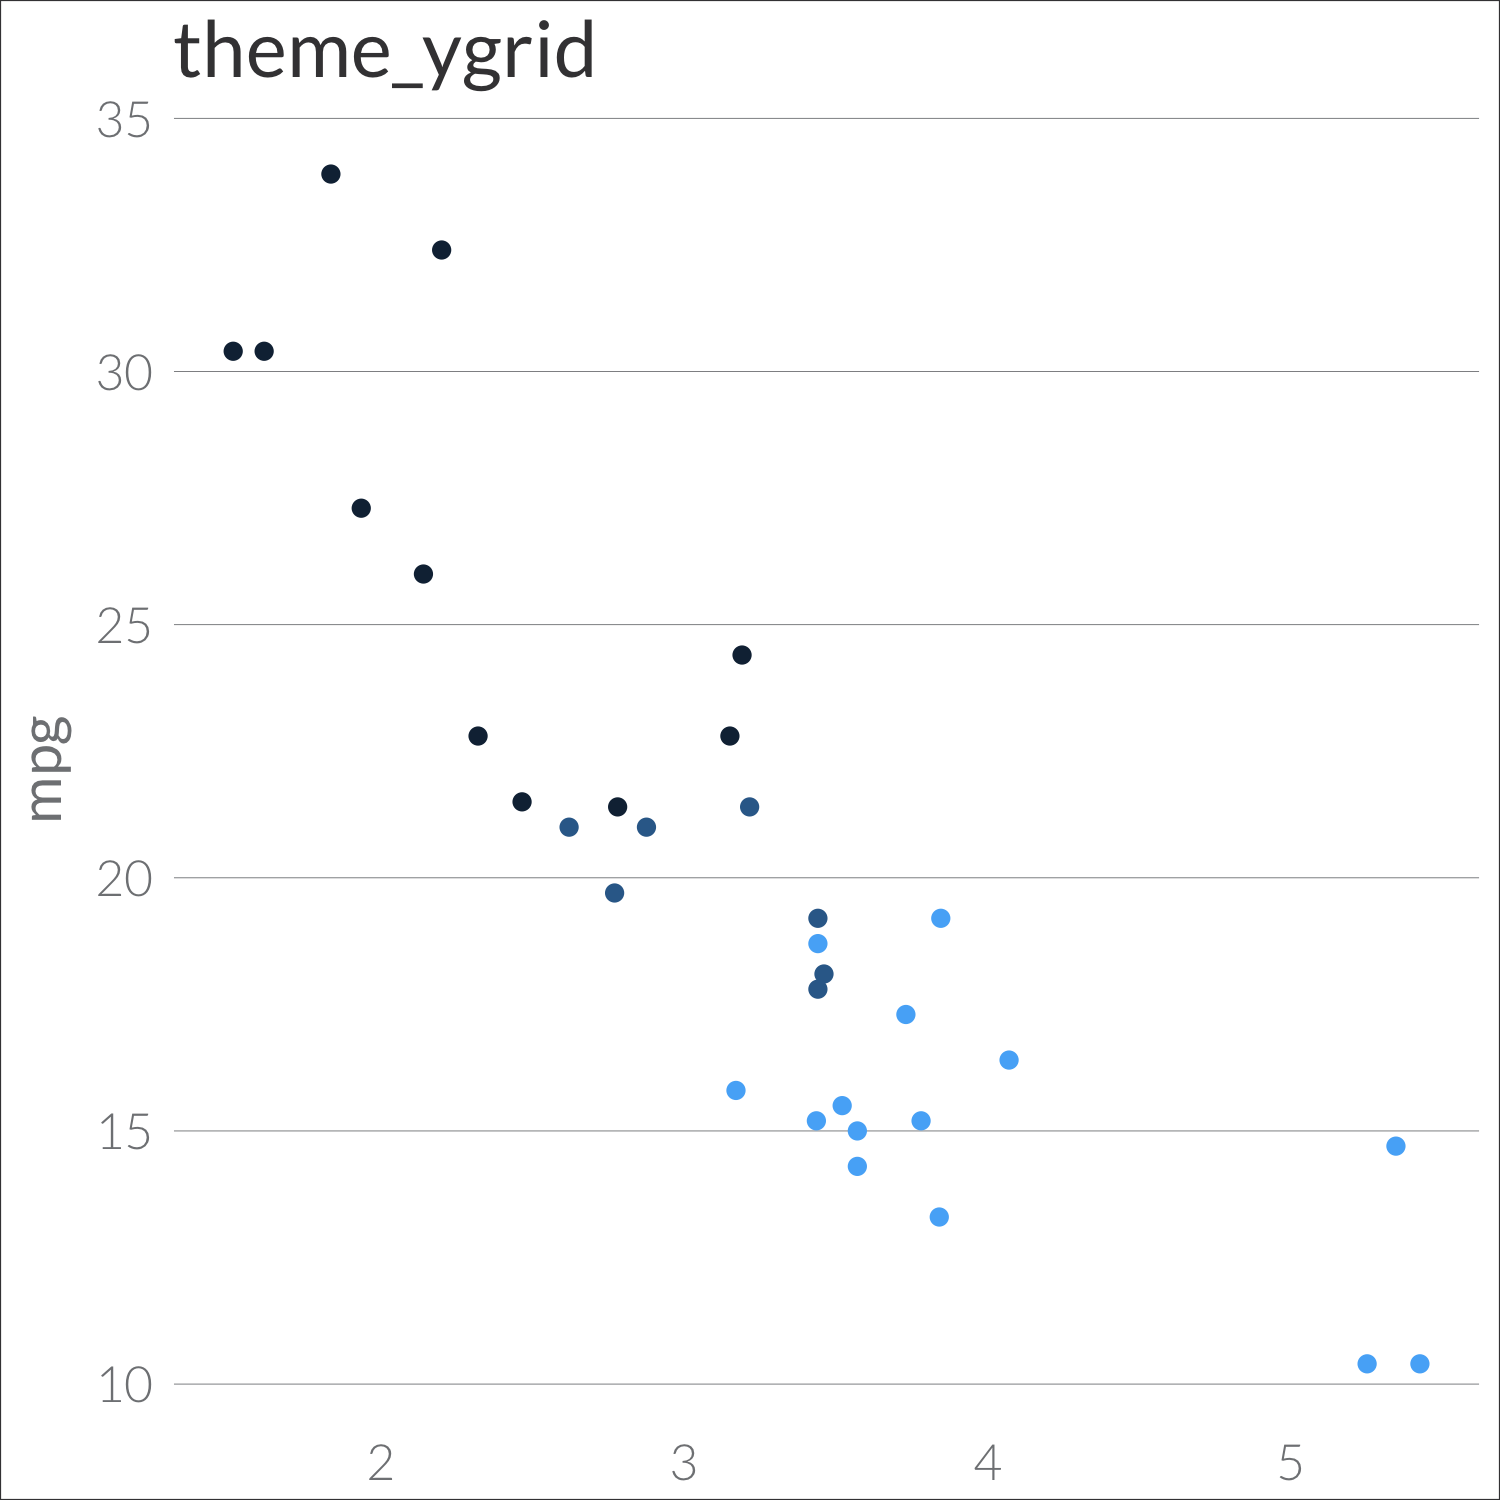 theme_ygrid
: y-grid lines, x- and y-axis labels, and y-axis title
theme_ygrid
: y-grid lines, x- and y-axis labels, and y-axis title
-
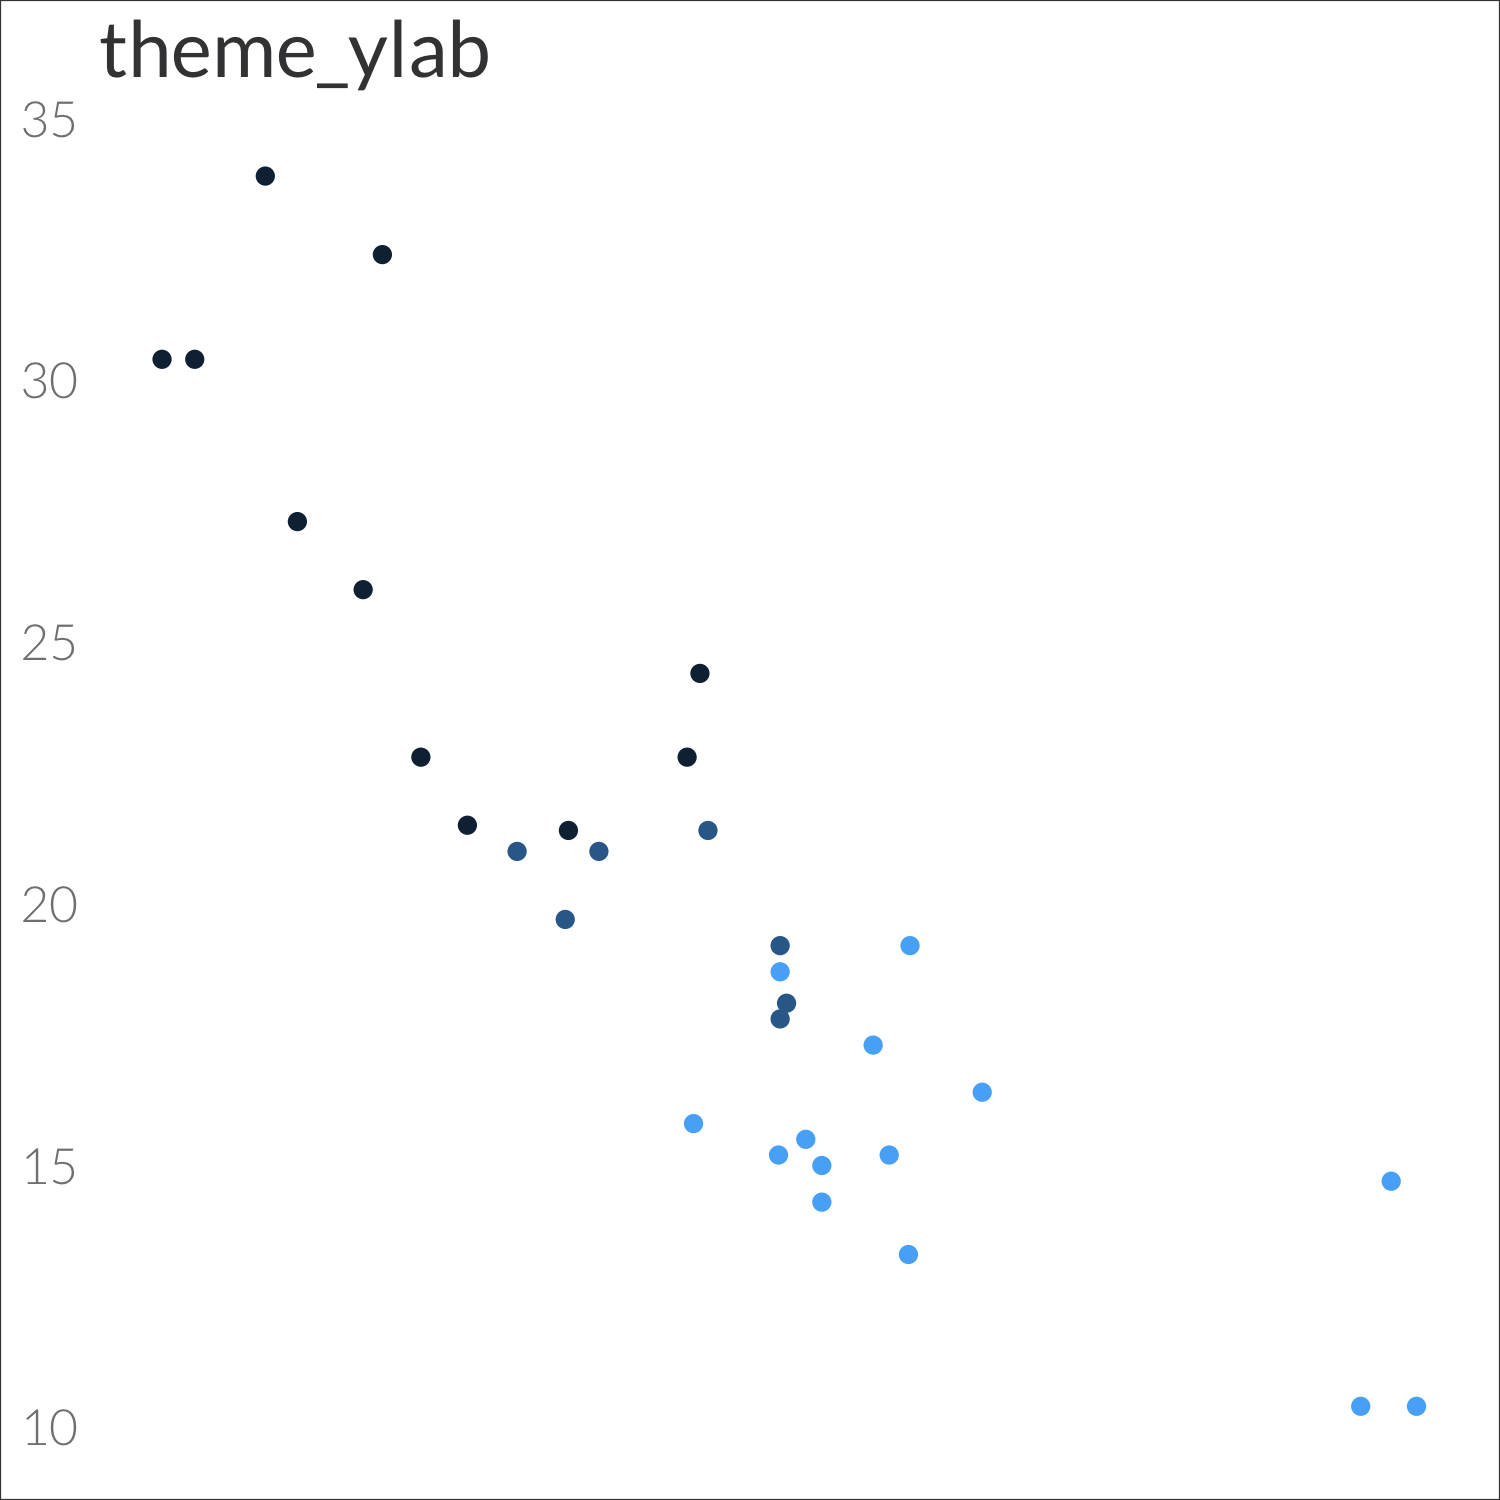 theme_ylab
: x-axis labels; no gridlines
theme_ylab
: x-axis labels; no gridlines
Mapping Functions
Mapping Helper Functions
Analysis / Helper Functions
- apply_code : applies a data dictionary to a set of numbers
- attributes : pulls or removes variable and value labels from labelled data
- calcPtEst : calculates point estimate (average) and number of observations, with or without weighting based on survey design
- check_font : Checks whether a font is installed in R
- convert01 : converts coded numbers to 0s and 1s
- factorize : assigns value labels to data frame
- formatNum : Prettifies numbers, especially for plotting
- loadPkgs : installs and loads frequently used R packages
- map_colour_text : maps the color of text based on underlying color
- save_plot : Saves the last plotted object to a .pdf
- scale_colour_text : changes the color of text based on underlying value
- stdize4regr : centers and scales values for a regression